The underlying volatility on the USDJPY pair heightened over the last several days, as global fears over a second coronavirus wave intensified. These concerns stem from the fact that newly confirmed cases appear to be surging as governments ease their containment restrictions.
As a consequence, the demand for safe-haven assets such as the Japanese yen and gold soared, just as the overall uncertainty started to rise yet again. This time, however, the situation is measurably different, compared to the early months of the pandemic. In early-March, the prevailing uncertainty caused significant market turmoil because nobody knew what to expect from the situation.
At present, the uncertainty is on the rise yet again, but this time it is more 'contained'. Chiefly, investors are concerned that a second wave could potentially compel governments worldwide to impose new lockdowns. In this sense, the underlying uncertainty is a lot more 'structured' compared to a few months prior.
The demand for low-risk securities is just as likely to fall promptly as soon as the market dismisses the likelihood of renewed economic closedowns. This is more than likely to occur because the world is currently in a much better position to handle a resurgence in newly confirmed cases compared to the early days of the pandemic.
Overall, the present surge in demand for safe havens such as the yen is more than likely to be proven short-lived as the underlying uncertainty starts to wane. That is why the purpose of today's analysis is to examine the behaviour of USDJPY's price action, and to project its most likely course of action as soon as the market prices in these new fundamental developments.
1. Long-Term Outlook:
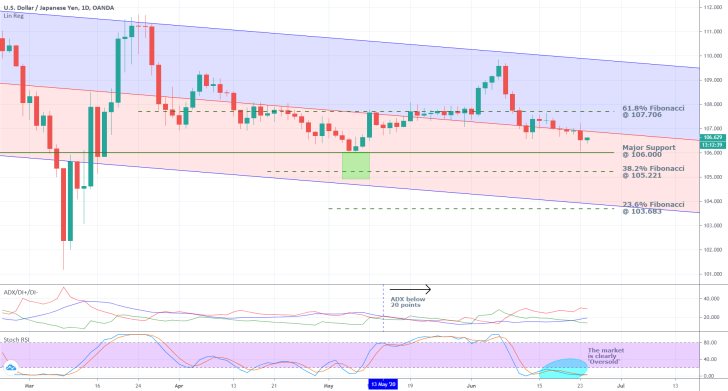
As can be seen on the daily chart below, the USDJPY remains ostensibly range-trading in spite of the recent resurgence in demand for the yen. The underlying price action remains trading in a narrow range, spanning between the 61.8 per cent Fibonacci retracement level at 107.706 and the major support level at 106.000. Additionally, the pair continues to trade very close to the descending channel's middle line. It should be mentioned that even though the USDJPY is not trending, such a channel is still useful in pinpointing the crucial test levels on the daily chart.

Notice that the ADX indicator has been threading below 20 points, which is even lower than the 25-point benchmark, since the 13th of May. It means that the USDJPY's price action has been consolidating for more than a month now and that the underlying range-trading environment is solid. Hence, the pair is likely to continue bouncing up and down between the edges of the broader range for as long as these muted conditions remain prevalent.
Meanwhile, the Stochastic RSI is demonstrating that the market is clearly oversold at present. The last time the indicator was in one of its two extremes, the price action concluded establishing the previous swing high, which was followed by a subsequent rebound. This entails the likely emergence of a new upswing in the next few days.
The aforementioned fundamental factors confirm such expectations. Most specifically, the expectations for the underlying uncertainty to subside shortly. Therefore, if the price action manages to break out above the descending channel's middle line, the next goal would be the 61.8 per cent Fibonacci retracement level at 107.706 (the range's upper limit). Conversely, the USDJPY could remain to consolidate below the channel's middle line, but above the major support level at 106.000 (the range's lower edge).
2. Short-Term Outlook:
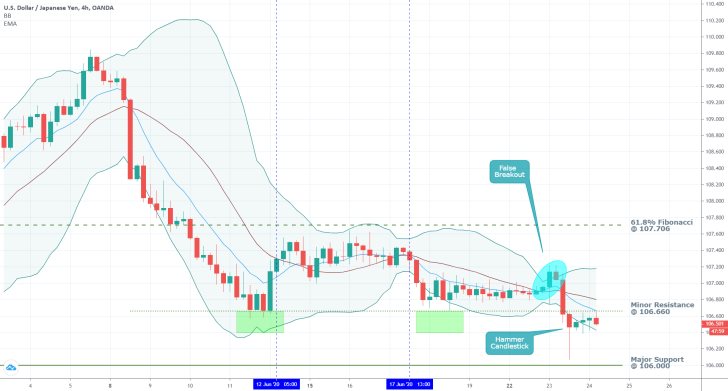
As can be seen on the 4H chart below, the price action remains concentrated below the 10-EMA (in blue), which, in turn, is positioned below the Bollinger Bands' middle line. This relationship is demonstrative of consistent selling pressure in the market. The price action would have to break out above the two moving averages before a more substantial bullish commitment can be established, but even this could prove to be insufficient.
The price action was trading above the two between the 12th of June and the 17th of June, but this came to no avail as no upswing was established. Later on, the price action developed a new false breakout, which was immediately followed by the most recent dropdown.

It is precisely here where the underlying market sentiment appears to be shifting. On the one hand, the emergence of this massive hammer candlestick, which is quite distinctive on the 4H chart, represents a significant confirmation of increasing buying pressure. Such candles typically highlight the beginning of new upswings, following the termination of a preceding downtrend.
On the other hand, the price action that followed the hammer was somewhat subdued, and it is currently consolidating below the minor resistance level at 106.660. If it fails to break out above this test level soon, then the market would likely struggle in establishing such an upswing.
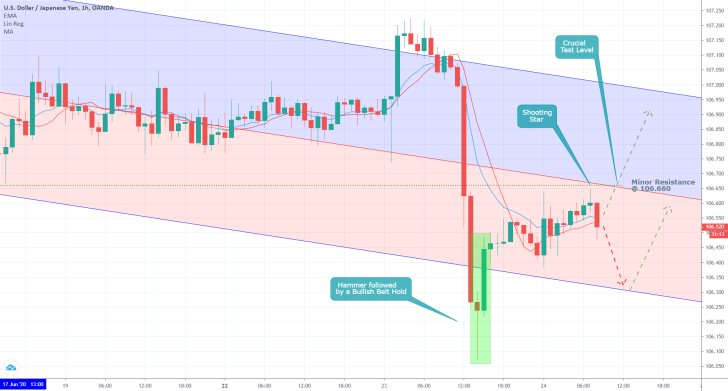
In the very short-term, the behaviour of the price action looks even more bullish. The aforementioned hammer (as seen on the 4H chart) is comprised of a minor hammer followed by a bullish belt hold, as seen on the hourly chart below. This confirms the termination of the previous downswing.
The price action is trading above the 10-day EMA (in blue), which is positioned above the 10-day MA. This relationship in the very short-term is exhibitive of rising buying pressure.
If the price action manages to break out above the minor resistance level at 106.660, which currently coincides with the regression channel's middle line, this would be strong enough piece of evidence to support the expectations for the establishment of a new uptrend.

3. Concluding Remarks:
At present, more and more evidence supporting the rising buying pressure keeps mounting. The price action is expected to bounce back up towards the aforementioned range's upper limit. However, the market bulls need to be patient, as a stronger confirmation is required.
If the price action manages to break out above the minor resistance level at 106.600 and the two MAs on the 4H price chart, then the next target for the newly developing upswing would be the 61.8 per cent Fibonacci retracement level at 107.706.

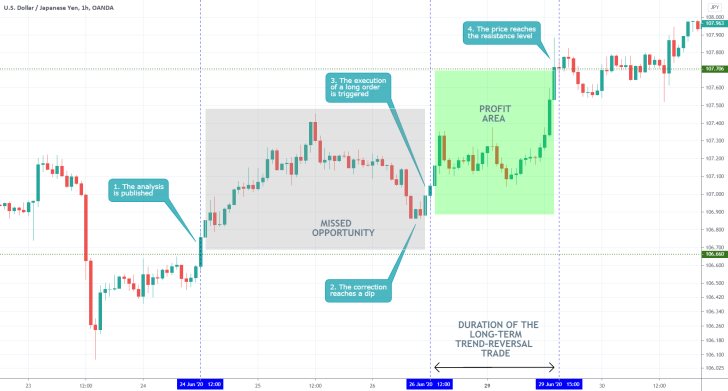
- The analysis did an excellent job of examining the impact of the underlying fundamental factors on the pair, as the price action did indeed reverse its course. It, however, was published relatively late, which is why no trading was carried out in the short-term. However, placing a long order at the dip of the bearish correction resulted in profits for the longer-term trade.
Disclaimer: Your capital is at risk! Trading and investing on the financial markets carries a significant risk of loss. Each material, shown on this website, is provided for educational purposes only. A perfect, 100% accurate method of analysis does not exist. If you make a decision to trade or invest, based on the information from this website, you will be doing it at your own risk. Under no circumstances is Trendsharks responsible for any capital losses or damages you might suffer, while using the company’s products and services. For more information read our Terms & Conditions and Risk Disclaimer.


