The second-biggest economy in the Eurozone is being devastated by the COVID-19 fallout on the French industry, and the underlying economic activity in France is at its lowest since the creation of the Eurozone. The European Central Bank has already pledged liquidity support and implemented emergency rescue packages, which are meant to support the reeling business at times when workers are stuck at home self-isolating.
Meanwhile, French President Emmanuel Macron has recently stressed that ‘the virus holds no passport’, referring to the apparent easiness with which the coronavirus seems to be sweeping through France, Europe as a whole, and all around the world. It is precisely the easiness with which the pandemic is still spreading that has illuminated the fragility of the global supply chains. Once those started breaking off due to the national lockdowns around the world, the French economy started feeling the real strain from the worldwide slowdown in economic activity.
The leading stocks index in France – the CAC 40 – represents clearly the impact of those distortions in the regular cycle on the broader French economy. It has tumbled by nearly 35 per cent over the course of the last several weeks since the pathogen started going viral globally after having broken the containment in China. In doing so, it affirmed Macron's words to a dreadful end.
If you’ve managed to catch up on our ‘Weekly Expectations Update’ from yesterday, you would know that today was a crucial day in France. The Markit institute released pivotal economic data regarding the observed performance of the French industry since the COVID-19 started weighing down on its performance. The Services PMI and Manufacturing PMI numbers, which were released earlier today, have already begun affecting the French stock market, and have left a noticeable imprint on the CAC 40's price action.
Therefore, it is the purpose of the present analysis to examine the current state of the French economy with regards to today's data releases and to project the most likely consequence for the index' future development.
1. Long Term Outlook:
As can be seen on the monthly chart below, the index has tumbled considerably over the past two months. It has broken down below the ascending channel's lower boundary, which is illustrative of strong bearish sentiment in the market. If the CAC index does not correct some of those losses by the end of March, the sheer size of the most recent candlestick is likely to prompt more longer-term bearish traders to join the market.
Consequently, through the execution of their short orders, these bearish traders are likely to prompt even more selloffs in the future. The relatively big lower shadow of the candlestick is already demonstrating that the underlying bullish pressure is not completely negated at present.
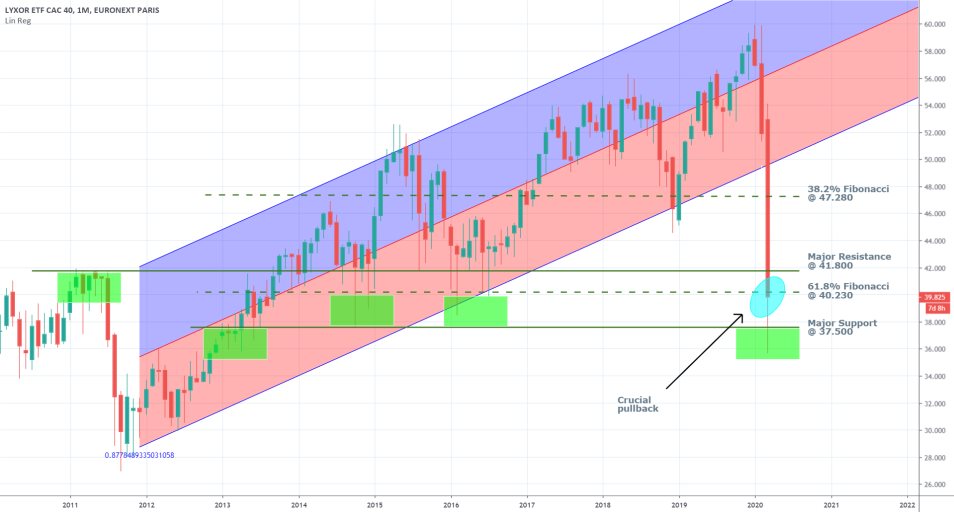
The price action has already bounced back up from the major support level at 37.500, after generating a failed attempt at a breakdown. This level has been prevailing since April of 2013, which is exhibitive of its strength.
The price is currently attempting to form a pullback above the pivotal 61.8 per cent Fibonacci retracement level at 40.230. If it succeeds and March's trading session closes above this psychologically important support level, this would be a clear indication that the market bears are not yet giving up and that the selloff is not as robust as it might look now.
If the pullback fails in this, however, April is likely to begin with a temporary consolidation of the underlying price action between the two aforementioned levels – the support at 37.500 and the then-to-be resistance at 40.230. Conversely, if the market bulls manage to take back control of the market, then they will have two major obstacles before a full recovery can even be considered – the major resistance level at 41.800 and the 38.2 per cent Fibonacci retracement at 47.280.
2. A Breakdown of the French Industry – Services and Manufacturing:
These two crucial factors are the essential components that comprise the broader economy, and the PMI data from today sheds light on the separate performances of the two sectors.
- Services PMI. It is no secret that the French economy, similar to the rest of the countries in the Eurozone, is mostly centred around the services industry. That is why the recorded performance by the Markit institute regarding the services component of the industry is also likely to have the most profound insights for the overall state of the French economy.
The services PMI was recorded at 52.50 in February and the consensus forecasts, which anticipated a severe drop from that level due to the coronavirus, projected 39.60 index points to be recorded in March. The final results of the report, however, came in at 29.00 points. According to Trading Economics, this is the lowest that the index has ever been since Markit began measurements in 1998.
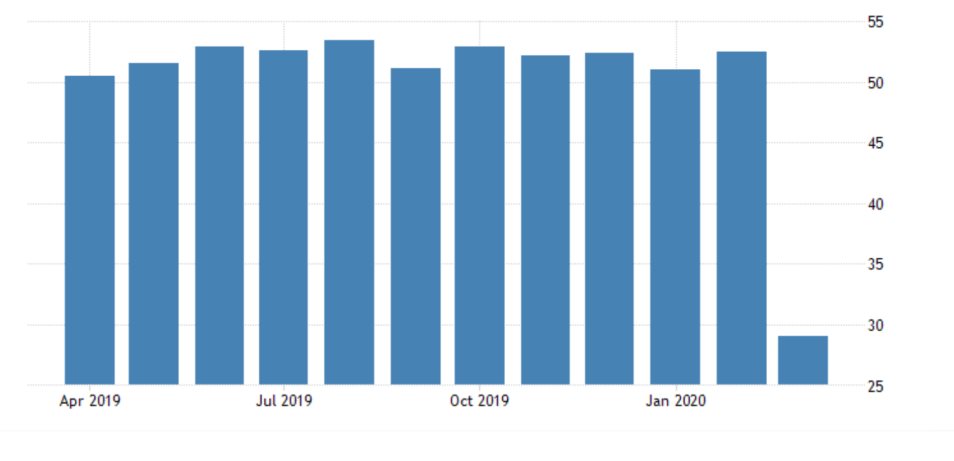
The worse-than-expected results of the Services PMI measurement for March are likely to have a noticeable reflection on CAC’s price action over the next days and weeks, as the market starts pricing in the information.
- Manufacturing PMI. Meanwhile, the one somewhat redeeming outcome from Tuesday’s report, gloomy as it may be, is that the observed drop in the Manufacturing PMI was not as drastic as initially expected.
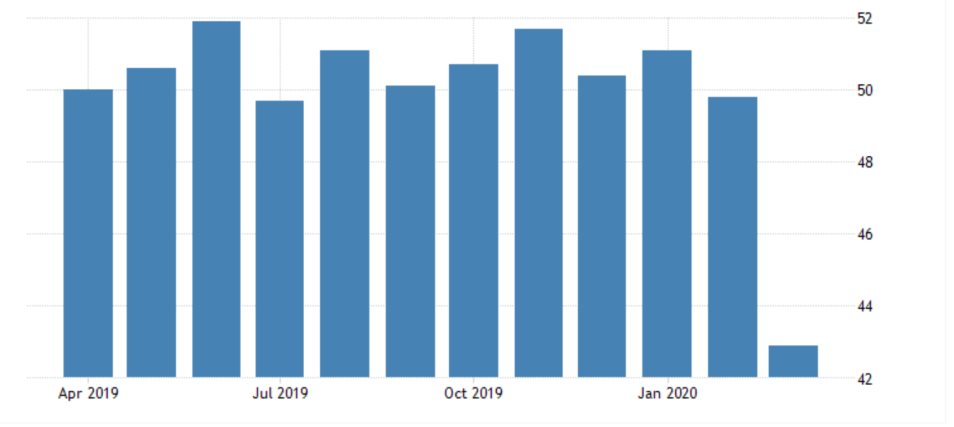
The index fell from 49.80 points, which were recorded in February, to 42.90 in April. This result is better than the consensus forecasts, which were projecting a more substantial drop in Manufacturing to 39.4.
The immediate impact of the better-than-expected manufacturing data was to offset some of the adverse shock, that was caused by the more drastic deterioration of the Services sector. These findings, however, could potentially have a more profound impact on the broader French economy in the longer run.
That is so because they illustrate the more pronounced resilience of the local manufacturing sector to unexpected external pressures such as the global outbreak of the coronavirus, which is in stark contrast to the dependence of the services sector on the wellbeing of the global supply chains and normal functioning of the global economy.
As regards the CAC index itself, the underlying fundamentals continue to play an important role for the index' value. In the short term, the index is likely to continue suffering from the overall muted economic data; however, its price is also likely to be supported by the global stock market rally. It is owing to all of the accommodation that central banks everywhere are offering to the reeling global economy.
In the longer term, France could potentially choose to transform its economy so that it is less dependent on the fragile global supply chains. This would mean that the CAC 40 would undergo some profound structural changes in addition to the anticipated process of global stabilization once the coronavirus crisis is dealt with.
3. Short Term Outlook:
As can be seen on the weekly chart below, there are two likely scenarios for the CAC that could transpire over the next few weeks. If the global stock rally comes to an abrupt end, the French index could break down below the major support at 37.500. This is the last significant barrier preventing the price action from continuing to head further south.
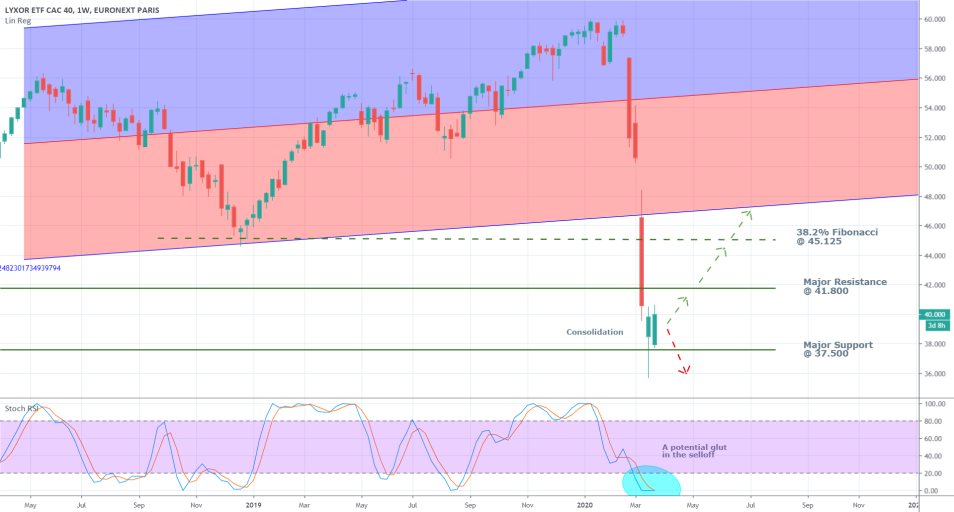
In contrast, the Stochastic RSI indicator is illustrating the glut in the market from all of the overselling that has transpired since the beginning of the crisis. Given that the market is demonstrating early signs of potential consolidation, the Relative Strength Index could prompt some of the market bulls to step up and begin executing long orders around the major support at 37.500, on the anticipation for a trend reversal. Such actions would support the current bullish pullback by raising the aggregate demand for the CAC 40 and changing the underlying market equilibrium.
If the correction persists and the price manages to break out above the major resistance level at 41.800 its next obstacle would be the 38.2 Fibonacci retracement (pertaining to the last bearish swing alone, and not the entire previous uptrend) at 45.125. It is interesting to note that this is the same price level that was reached by the dip of the previous major bearish correction. Hence, if the current bullish spike does indeed continue to evolve past the major resistance at 41.800, then it would have a much tougher time in breaking out above the 45.125 Fibonacci resistance.
As can be seen on the daily chart below, the recent bearish downswing is exhibiting behaviour reminiscent of a classic 1-5 impulse wave pattern of the Elliott Wave Theory.
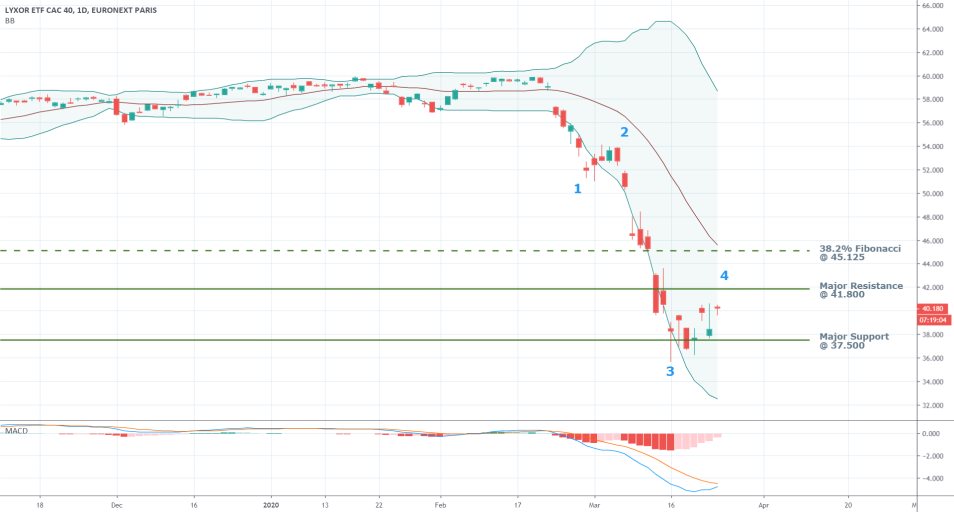
If the price continues to evolve under the postulations of EWT, it should be then expected that the aforementioned bullish pullback would behave as a part of the bigger structure of a 1-5 impulse wave. Hence, once the 3-4 pullback reaches a new top, the price would then likely continue heading lower as a part of the pattern’s last impulse leg at 4-5. Hence, EWT favours the continuation of the downswing’s development.
Meanwhile, the MACD is demonstrating that the 26-day EMA is attempting to form a bullish crossover, which would support the continuation of the bullish momentum. Hover, this behaviour of the MACD could also be interpreted as representing a temporary consolidation before the more significant bearish momentum continues rising once again.
4. Concluding Remarks:
The CAC 40 continues to suffer from the uncertainty that is created by the coronavirus pandemic. The underlying economic factors seem to favour the continuation of the bearish sentiment; however, global stocks have recently started rallying on central banks' actions.
Hence, the available information is mixed, and at the present moment, both bulls and bears could take the lead over the next days. The underlying market pressures are changing drastically almost every day.
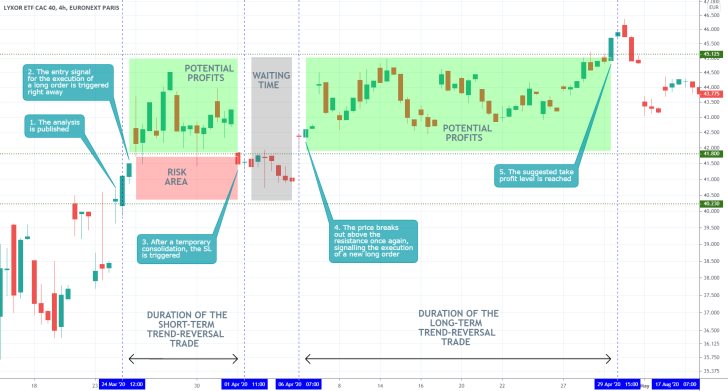
- Yet another example of trend reversal trading strategies being applied to a very particular market setup – the transition of the CAC 40 index from having an ostensibly bearish sentiment into forming a new bullish trend. Overall, excellent execution. Traders need to remember that the price action tends to be quite volatile when the market is changing directions in such a fashion, which means that traders need to be prepared for quite a lot of adverse fluctuations. Hence, they may need to execute several orders before the market finally starts going in their anticipated direction. That is why the short-term trade ultimately failed, but the longer-term one succeeded, as the underlying price action was consolidating around the support at 41.800.
Disclaimer: Your capital is at risk! Trading and investing on the financial markets carries a significant risk of loss. Each material, shown on this website, is provided for educational purposes only. A perfect, 100% accurate method of analysis does not exist. If you make a decision to trade or invest, based on the information from this website, you will be doing it at your own risk. Under no circumstances is Trendsharks responsible for any capital losses or damages you might suffer, while using the company’s products and services. For more information read our Terms & Conditions and Risk Disclaimer.


