The EURUSD is currently in the process of establishing a Distribution range, as postulated by the Wyckoff cycle theory. What this implies is that the pair is transitioning from the established bullish trend into a new possible downtrend, a process that could take up to several weeks to complete. Nevertheless, the situation looks different in the shorter-term following a recent bullish rebound.
While the current week looks quite an uneventful one judging by the economic calendar, the expectations for robust durable goods orders in the U.S. scheduled for publication on Thursday could reinvigorate the greenback in the short-term. Consequently, EURUSD's temporary bullish momentum is about to be tested in several days.
This week's comparatively uneventful economic schedule is suitable for a transition from trending to a ranging market, like the one outlined above. It follows that while the EURUSD pair looks poised to continue climbing in the immediate future, the bulls do not have many reasons to anticipate trend continuation. Quite the contrary, the overall sentiment seems prevailingly bearish-oriented.
1. Long-Term Outlook:
As can be seen on the daily chart below, the aforementioned transition from trending into a ranging (at least momentarily) market environment is underpinned by the emergence of a bearish Flag pattern. The latter bottomed out at the 23.6 per cent Fibonacci retracement level at 1.19429, which was converging with the 100-day MA (in blue) at that time. Given this rebound, the emergence of a minor bullish correction does not seem at all that surprising, even though the broader sentiment continues to become increasingly more bearish.
While the price action remains trading above the Flag's upper boundary, this would be considered an attempt at breaking higher towards the major resistance at 1.23000. Nevertheless, the possibility of abrupt bearish reversals should not be completely ruled out, as the price action may yet change directions towards the psychologically significant 23.6 per cent Fibonacci retracement level at 1.19429. Such erratic fluctuations between the two price levels, which look set to become the two borders of a new Distribution range, are to be expected as the underlying market sentiment becomes less pronounced.
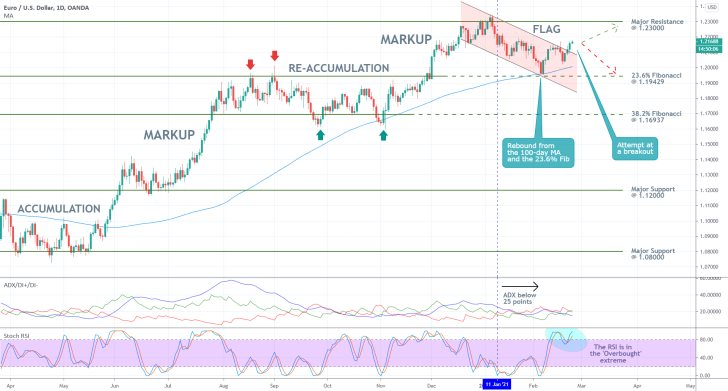
Notice that the ADX indicator has been threading below the 25-point benchmark since the 11th of January, coinciding with the beginning of the Flag's creation. This reading of the indicator is inlined with the expectations for a more explicitly range-trading environment.
Moreover, the Stochastic RSI indicator is currently in its 'Overbought' extreme, which, given the ranging sentiment, is more likely to drive the price action once again towards 23.6 per cent Fibonacci in the near term.
2. Short-Term Outlook:
As can be seen on the 4H chart below, the pair recently concluded establishing an Inverted Head and Shoulders pattern, as per the projections of our previous analysis. This type of pattern typically entails likely bullish reversals and continued appreciation of the underlying price action. That is the primary reason why the EURUSD could bounce back towards the major resistance at 1.23000 in the foreseeable future.
Nevertheless, one last test for the bulls remains - the upper boundary of the Neckline at 1.21800. The Inverted H&S pattern cannot be fully completed unless the price action manages to develop a decisive breakout above this level.
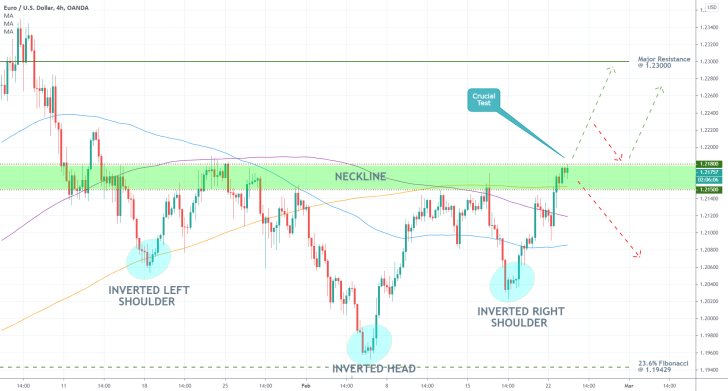
The fact that the price action is currently trading above the 100-day MA (in blue), the 200-day MA (in purple) and the 300-day MA (in orange) encompasses the strong bullish sentiment in the market. However, a failed breakout above 1.21800 would allow for another reversal towards the lowest floating support (the 100-day MA). In contrast, a breakout above the Neckline could potentially be followed by a throwback to 1.21800 (now as a support), which would allow bulls to add to their buying positions.
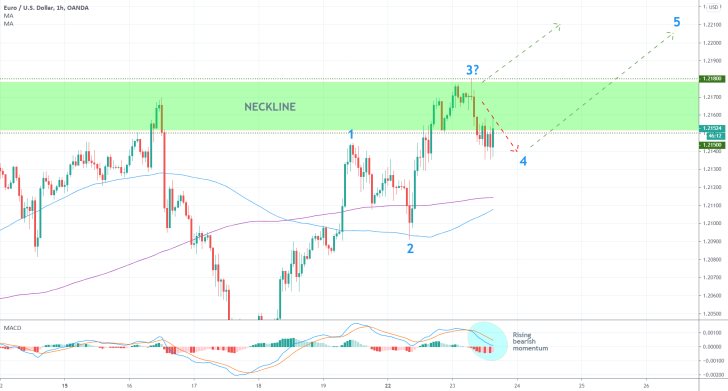
The currently emerging upswing can be viewed as a bullish 1-5 impulse wave pattern, as depicted on the hourly chart below. Notice that the price action appears to have peaked at point 3, just below the Neckline's upper boundary. At present, the price action is developing the second retracement leg (3-4), which also serves the role of a fakedown below the Neckline. On the condition that the price action manages to consolidate above the preceding swing high (the peak at point 1), this would allow for the 1-5 pattern to begin establishing the final impulse leg (4-5).
The price action remains concentrated above the two moving averages, which represents yet another bullish confirmation. However, the underlying momentum in the short-term is turning bearish, as underlined by the MACD indicator.
3. Concluding Remarks:
Market bulls should not rush to join the market right away, in the midst of an already developing upswing. Instead, they need to wait for an opportune moment - bottoming out of the price action near point 4 or a throwback to the Neckline's upper boundary (then as a support) after a breakout.
They would be able to use trend continuation trading strategies at both of these scenarios, with the final goal being the major resistance at 1.23000. This level is expected to serve the role of an upper border for a newly emerging Distribution range, so the bulls should be ready for erratic fluctuations around that level if the price action does manage to reach it.
Market bears, in contrast, need to be patient as well. A prolonged consolidation of the price action below the Neckline would illustrate likely exhaustion of the underlying bullish sentiment. In other words, they would be able to sell the EURUSD on the condition that the price action fails to break out above the Neckline over the next following days.
More risk-averse bears could wait for the price action to possibly reach the major resistance at 1.23000 before they utilise reversal trading strategies on the expectation for a rebound towards the 23.6 per cent Fibonacci. Remember, the latter is expected to serve the role of a lower edge for the newly emerging Distribution range.
The EURUSD Set to Complete an Elliott Wave Correction
The EURUSD has been falling steadily for over ten days now, and the pair is likely to continue depreciating in the foreseeable future. This is due to the changing fundamental conditions, as was argued in the initial analysis.
Rising U.S. yields continue to underpin improving investors sentiment, which is causing an upsurge in demand for riskier assets. As a consequence, the demand for the greenback is also rising. Meanwhile, the value of the single currency is falling owing to the bumpy and uneven recovery that is being observed in the Euro Area.
While the underlying fundamentals remain favourable for the likely continuation of EURUSD's further depreciation, there is one additional economic release scheduled for tomorrow that could tip the pair's sentiment scales in either direction. The February Non-Farm Payrolls could very likely affect the demand for the greenback until the end of this week's trading session.
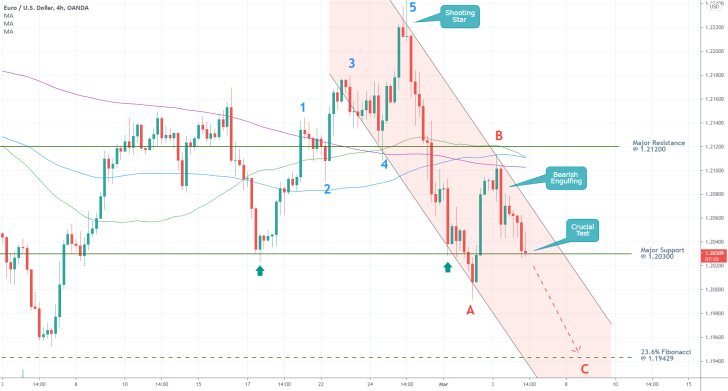
The prevailingly bearish bias resulting from the above-mentioned fundamentals seems to be inlined with the underlying behaviour of EURUSD's price action on the 4H chart above. As shown, the price action recently concluded establishing a 1-5 impulse wave pattern, as postulated by the Elliott Wave Theory.
Following its completion, the price action started developing a corrective ABC pattern, which is why the bearish correction is expected to continue probing lower. Namely, the ABC correction could fall as low as the next psychological target - the 23.6 per cent Fibonacci retracement level at 1.19429.
It is interesting to point out the fact that the correction's retracement leg (A-B) peaked just below the 200-day MA (in purple), thereby delineating the upper boundary of a descending channel. This further substantiates the expectations for the emergence of an additional downswing towards the channel's lower boundary.
Meanwhile, the 50-day MA (in green) is about to cross below the 100-day MA (in blue), and the two moving averages would then likely attempt to break down below the 200-day MA. Such a development would elucidate the robust bearish sentiment in the market.
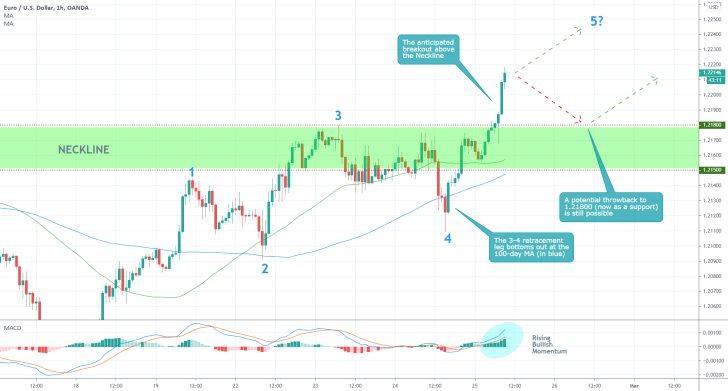
- As was argued in the analysis, the Elliott Wave's second retracement leg (3-4) bottomed out eventually, allowing bulls to join the market using trend continuation strategies. The dip at point 4 was reached after the price action failed to break down below the 100-day MA (in blue).
- The EURUSD broke out above the Neckline's upper boundary at 1.21800 decisively, which underscores the strength of the current bullish sentiment in the market. This is further demonstrated by the MACD indicator, which illustrates rising bullish momentum.
- While the price action looks poised to continue appreciating in the near future, there is still the possibility of a minor throwback to 1.21800 (now as a support level), which would, in turn, allow bulls to add to their existing positions.
- The major resistance level at 1.23000 remains the next target for the current upswing, however, it could be cut sooner if the underlying fundamentals change in the meantime. Traders also need to keep in mind that any decisive breakdown below the Neckline could potentially imply premature termination of the trading setup.
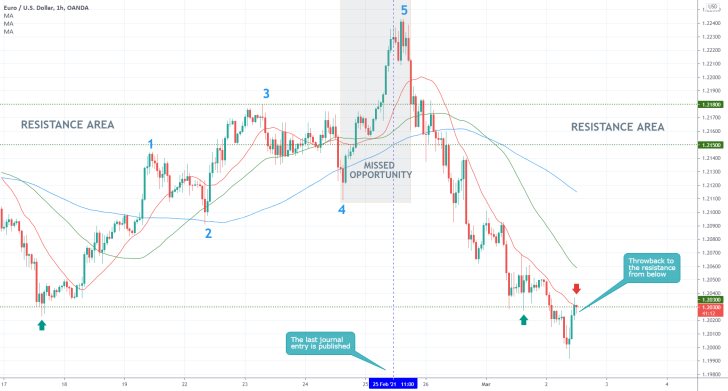
- Even though the analysis successfully projected the development of a final (4-5) impulse leg, the opportunity was not seized. This resulted in an opportunity cost of 100 pips (missed opportunity in grey).
- The subsequent bearish rebound was also missed due to the fact that the analysis did not anticipate the possibility of a snap bearish reversal following the completion of the Inverted Head and Shoulders pattern.
- Even though no losses were incurred on the above setup, it is generally considered to be a failure because the examined opportunity was not taken advantage of. Traders need to have the necessary resolve to act on their expectations and believe in the strength of their own projections.
- The price action is currently consolidating below the major support (currently resistance) level at 1.20300, which is converging with the 20-day MA (in red). Its behaviour around this crucial make-it-or-break-it level will elucidate the near-term future of the pair.
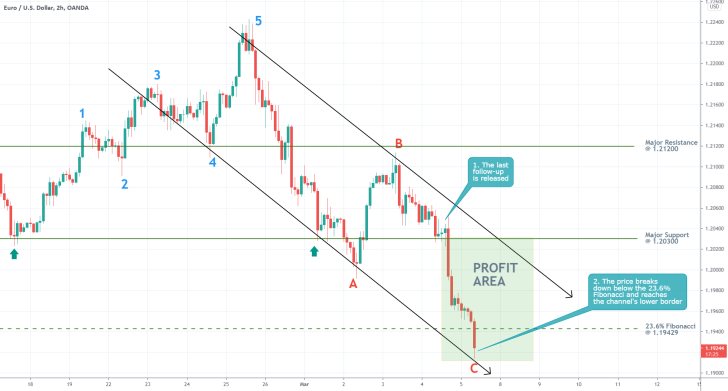
- The last follow up quite successfully projected the development of a corrective ABC pattern (to the preceding 1-5 impulse wave pattern), catching the better part of the BC leg.
- Seeing as how the price action is currently trading below the psychologically significant support at the 23.6 per cent Fibonacci (1.19429), bears who have open positions can implement floating profits or losses in order to squeeze the maximum out of the remaining bearish potential. For instance, they can place a fixed SL at 1.19429 and/or floating TP from the current market price.
Disclaimer: Your capital is at risk! Trading and investing on the financial markets carries a significant risk of loss. Each material, shown on this website, is provided for educational purposes only. A perfect, 100% accurate method of analysis does not exist. If you make a decision to trade or invest, based on the information from this website, you will be doing it at your own risk. Under no circumstances is Trendsharks responsible for any capital losses or damages you might suffer, while using the company’s products and services. For more information read our Terms & Conditions and Risk Disclaimer.


