Economists and policymakers have spent the last several days pondering over the Dow Jones Industrial Average Index's incredible advance that unfolded last week. Some argue that the nearly 13 per cent weekly gains mark the beginning of a new major bullish correction and the end of the previous selloff. In contrast, others caution against false bottoms and the risk of further losses down the line.
At any rate, the coronavirus pandemic presents an unprecedented ordeal for the global economy, and questioning whether the Dow is currently in a bearish or bullish market is ultimately futile. Due to the novelty of the current situation, we do not have any comprehensive models that we could use to probe the underlying data and make sense of the index’ recent behaviour.
In that sense, we can candidly assert that the Dow Jones currently finds itself in no man’s land – it could just as likely fall, consolidate, or rise, in the next following weeks. It all depends on how the global pandemic will develop from here on out, and in what way the measures taken by national governments and central banks worldwide are going to support the struggling global economy.
The purpose of the current analysis is to examine the underlying data and the available information that we do know about the impact of the virus on the US stock market. Additionally, the analysis sets out to delineate on the behaviour of the Dow's price action and to categorise the underlying causes that could propel the price in either direction.
1. Long Term Outlook:
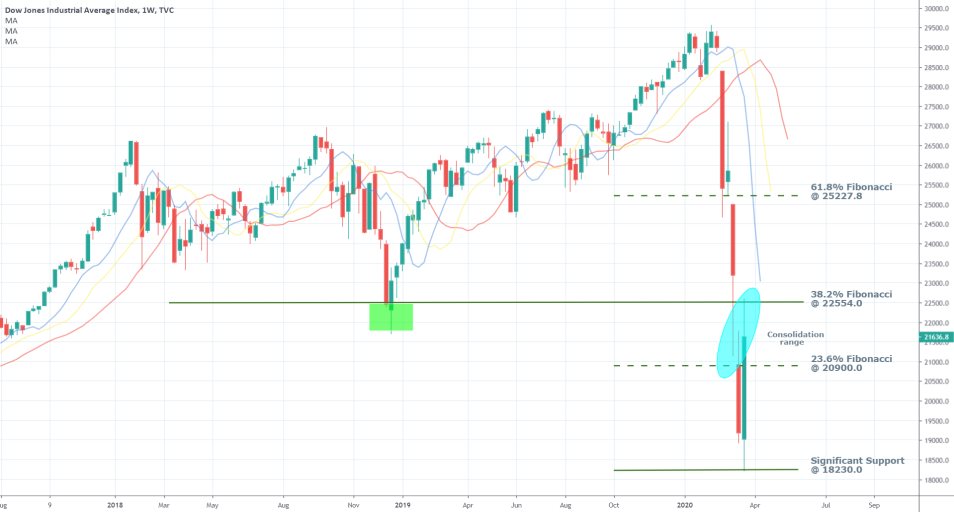
As can be seen from the weekly chart below, the index had plummeted by nearly 40 per cent at the height of the selloff before last week's correction of 12.84 per cent. Some market experts already see this remarkable pullback as a positive sign, and some have even argued that the Dow Jones has technically bounced back up into a bullish market.
“It’s a development that speaks to the tenuousness of market conventions in times of extreme volatility. The biggest rally since 1933 helped push the gauge up the requisite 20% from the low it hit Monday, meeting one time-honored definition of a bull market.”
On the other hand, it is highly uncommon for distinct bearish markets to end with a sharp U-turn. Usually, a bottom is reached much more steadily, and the transition from a bearish to bullish market is much slower and gradual. That is why other traders and market experts perceive last week's spike as being a temporary pullback before the underlying bearish sentiment resumes pushing the price action further south.

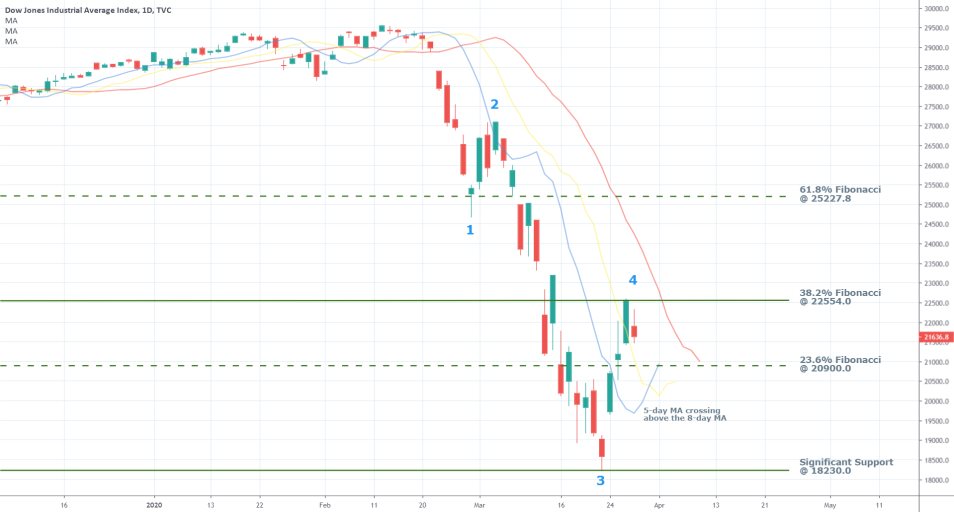
The market momentum is unequivocally bearish. This is confirmed by the three moving averages, which are aligned in a perfect order – the 5-day MA (blue) is below the 8-day MA (yellow) which is below the 13-day MA (red). Until there is a positive crossover in which the MAs with lower timeframes surpass the MAs with bigger timeframes, the underlying market moment would remain distinctly bearish.
Until the condition of the market momentum is changed, the execution of any long orders would be considered to be contrarian in nature and involving a high degree of risk. Meanwhile, the same kind of adverse volatility, which is quite high at the present moment, would be disadvantaging the execution of short orders as well. That is so because the DJI price is evidently prone to spiking up and down due to the prevailing COVID-19 uncertainty. Hence, both selling and buying in the current market environment entail different in nature but comparable in scope types of risk.
A dip was reached last week - it remains to be seen whether it is going to be temporary or a permanent one – at the significant support level at 18230.0. Afterwards, the price bounced back up and broke out above the 23.6 per cent Fibonacci retracement level at 20900.0, which is currently acting as a support. The upsurge from last week also managed to test the strength of the 38.2 per cent Fibonacci retracement level at 22554.0 but failed to break it.
The quick pullback from that level demonstrates its strength and significance as a crucial resistance level. The 22554.0 price level served as a prominent support for the previous bearish correction (the green rectangle on the chart), and it was where a dip was reached back then. Hence, the current bullish upswing is going to have a tough time ahead in breaking out above-set level. However, if it manages to do so, this would be a significant indication of the bullish commitment in the market.
In other words, breaking out and closing above 22554.0 is going to be the most telling evidence that the stock market rout might indeed be terminated, and that the Dow has entered into a bullish market once again. Conversely, the 38.2 per cent Fibonacci retracement presents an excellent opportunity for market bears to enter short at a discount. Therefore, heightened selling pressure can be expected to occur around that resistance level, as most bears would be expecting a peak in last week's pullback to happen somewhere around it. In that sense, the resistance level at 22554.0 is equally important for both market bears and bulls, and both would be closely monitoring the behaviour of the price action around that level.
For the time being, the DJI remains consolidating in a range between the 38.2 per cent Fibonacci retracement at 22554.0 and the 23.6 per cent Fibonacci retracement at 20900.0 – the no man’s land. If the price does indeed manage to break out above the resistance level, then the next crucial target would be the 61.8 per cent Fibonacci retracement at 25227.8.
2. What is Causing the DJI to Surge Even as Prospects of High Unemployment Loom Closer?
A peculiar thing occurred on Thursday when the US Department of Labor reported 3.28 million jobless claims for March – a drastic surge in the number of people asking for unemployment benefits after many small businesses were forced to lay off workers amidst the COVID-19 fallout. Even with these alarming statistics, however, the Dow Jones Industrial Average rose by 6.38 per cent that day. The upswing was halted at the aforementioned 22554.0 resistance level. But why did the DJI rise that day at all when the unemployment rate in the US appears almost certain to surge this month as more and more people go into self-isolation?
The answer to this question is complex, but it could shed more light into the nature of the recent market selloff, and it could also illustrate the eventual end of the bearish run. As we argued in our market update from Friday, the nature of the jobs claims report from Thursday is much more multi-faceted than it appears at first glance. Said in simpler terms, even though 3.28 million people filed for financial support, it does not mean that 3.28 million people have been decidedly thrown out of the workforce due to the coronavirus outbreak.
The DJI rose on Thursday because market experts recognised multi-layered nature of the report’s findings, and traders still believe that the situation could be resolved relatively quickly (by the end of the year), provided that the epidemic is handled promptly.
There are roughly three types of unemployment – structural; in-between jobs; and voluntary nonparticipation. The first type refers to those types of individuals who could not participate in the labour force for one or more reasons. They could be disabled, or they could lack the technological know-how of performing a particular task. Usually, structural unemployment encompasses those individuals who want to work but have been left out of the labour force for an extended period of time. The recent monetary policy adjustments by the FED and also the stimulus packages released by the US government are meant to prevent a surge in structural unemployment.
The second type of unemployment refers to the people who have been laid off work or have quit their previous jobs and are currently looking for a new position. There are always people who are in-between jobs, and that is why a zero per cent unemployment is virtually an impossible task. For the time being, it is believed that the COVID-19 outbreak's most significant impact is affecting this particular branch in the overall unemployment, as many small and medium businesses are temporarily closing down. However, if the situation is handled relatively fast, and the usual economic processes resume in several weeks or months, these workers are anticipated to re-join the workforce relatively quickly. Thereby, no significant surges in structural unemployment are expected to be caused by the coronavirus, which is why the overall unemployment rate is not likely to rise drastically in the long run.
The last category refers to the individuals who voluntarily decide to leave the workforce if they think they do not need a monthly income to get by. The US government has agreed to extend a credit line directly to American individuals and families in order to help them financially while they remain isolated in their homes. It would be quite reasonable to expect that at least a portion of the 3.28 million unemployment claims have been made by people who have decided to quit their jobs and stay at home while the pandemic lasts. Such people would rather live off the government stimulus while isolating themselves, but would then re-join the workforce when the coronavirus crisis in the US is dealt with. Such people are not going to contribute to a long-term surge in structural unemployment as well, which is welcoming news.
Hence, the strengthening of the Dow on Thursday was prompted by the anticipation that the situation in the US labour market is ‘not as bad as it looks like’. The value of the index is likely to continue being supported by government stimulus, and its rally is going to depend on investors’ perception of the economic fallout’s scope. In other words, the DJI is likely to continue strengthening (or at least consolidate) for as long as the market continues to believe that the financial relief package that is being advanced by the government is going to prevent dramatic surges in structural unemployment in the long run.
3. Short Term Outlook:
As can be seen on the daily chart below, the 5-day MA has managed to cross over the 8-day MA, which is exhibitive of rising bullish momentum in the short run. Even still, for the time being, the price is failing to break out above the aforementioned 38.2 per cent Fibonacci retracement level, which makes it look as though the bullish correction has reached a peak.
This assertion can be tested by the Elliott Wave Theory, which proposes a 1-5 impulse wave pattern for categorising the behaviour of market trends. The recent markdown has already formed two distinct dips – at 1 and 3. This means that 1-2 and 3-4 are the bullish pullbacks in a broader 1-5 bearish wave pattern. It follows that, unless the pattern is terminated prematurely, the price action is about to form the final impulse 4-5.
If this inference is proven correct, this means that the price is likely going to bounce back from the current resistance, break down below the significant support level at 18230.0 and continue heading further south before a more decisive dip is reached.

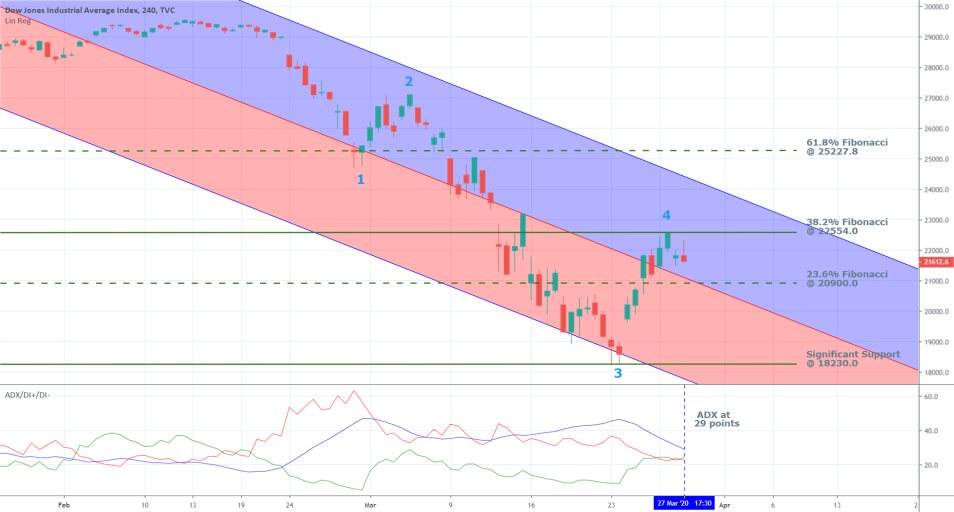
The 4H chart below reveals that the price action has recently surfaced in the upper part of a regression channel, which entails a rise in bullish sentiment in the short run.
The ADX closed last week's trading session at 29 index points, which illustrates robust trending environment. Under these conditions, heightened price fluctuations are to be expected to occur in both directions. The trend, however, remains positively bearish, even though the recent bullish correction has lessened its strength to a degree.
The 23.6 per cent Fibonacci retracement level at 20900.0 coincides with the channel's middle line, which makes it an even more critical support level. Should the price manage to break down below set support, this would be a clear indication that the bearish sentiment in the market is gearing up once again. Additionally, such behaviour of the price action would likely prompt even more bears to enter short on the anticipation for the continuation of the downswing, which would further bolster the underlying selling pressure in the market.

4. Concluding Remarks:
The Dow Jones Industrial Average is quite volatile at present due to the many external factors that are currently affecting its price. There are reasons to believe that the price could extend last week’s gains and continue heading further north, however, there are also reasons to believe that the bullish correction has reached a peak and the index is due for a new downswing.
That is why we prefer to refrain from saying that the market as being either distinctly bearish or bullish, rather we chose to argue in favour of the ‘no man’s land’ approach. The price is currently threading in no man's land, between the 38.2 per cent Fibonacci resistance and the 23.6 per cent Fibonacci support. Once it breaks away from the boundaries of this range in either direction, more precise projections can be made.

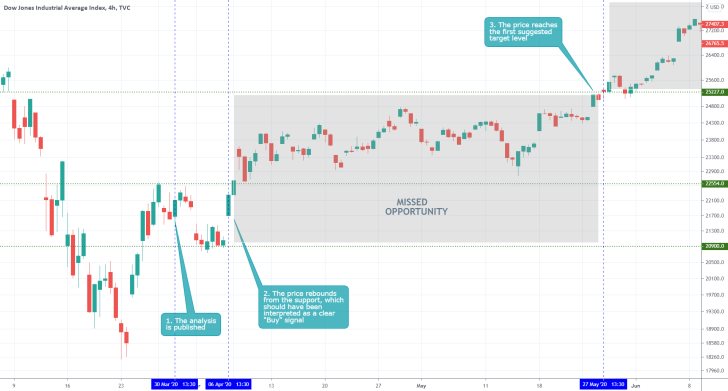
- Even though the outlined support and resistance levels in analysis were spot on, no trade was placed out of fear of adverse volatility, leading to huge missed opportunities. The reason as to why no trade was placed, is owing to the fact that the market had crashed recently, which meant that trading on the expectations for a rebound would have been quite taxing mentally. While refraining from trading at times when there is so much uncertainty in the market is admirable, traders should believe in the strengths of their own forecasts. Otherwise, they cannot survive for long on the markets. Moreover, having an opinion of the market's behaviour after carrying out due research, but not acting on it could be especially detrimental to a trader emotionally, if the market does indeed go on to behave in the manner he had expected.
Disclaimer: Your capital is at risk! Trading and investing on the financial markets carries a significant risk of loss. Each material, shown on this website, is provided for educational purposes only. A perfect, 100% accurate method of analysis does not exist. If you make a decision to trade or invest, based on the information from this website, you will be doing it at your own risk. Under no circumstances is Trendsharks responsible for any capital losses or damages you might suffer, while using the company’s products and services. For more information read our Terms & Conditions and Risk Disclaimer.


