The price of crude oil has been advancing in a very strong uptrend over the past couple of weeks. The rally was influenced by robust energy demand globally as economies continue to reopen and economic activity picks up. This pick-up in aggregate activity continues to be dependent on the vaccine rollout and future progression of the pandemic.
Thus, the substantial increase in energy demand globally caused the price of crude oil to climb to the area of $73.00-$74.00 per barrel, which was last reached in late 2018. This represents a major make-it-or-break-it threshold of historic significance, which is why some bears might be expecting a correction to be initiated from this peak. But can there be enough selling pressure to jolt the strong demand for the commodity?
This week's OPEC meeting would be of significant importance for the price of crude oil in the near future, as traders and investors would be expecting to hear any potential changes in OPEC's rhetoric. Check out our Weekly Expectations article for more information about that.
Depending on how the OPEC conference goes on Thursday, the underlying volatility currently affecting the price of crude can increase noticeably. Consequently, the outcome of the meeting could potentially catalyse such a correction, though it remains to be seen whether anything significant would be mentioned on Thursday.
Is the End of the Current Markup in Sight?
The behaviour of the underlying price action matches the expectations of the Wyckoff Cycle Theory closely. As shown on the daily chart below, two Markups that are separated by a Re-Accumulation range comprise the broader rally.
This means that if the price action goes on to start trading horizontally over the next several days, this could signal a new Distribution. The emergence of such a range would be demonstrative of diminishing bullish pressure, potentially resulting in the creation of a more sizable Markdown.
The MACD indicator is already underpinning the falling bullish pressure. This can be observed by the fact that the histogram has been decreasing over the past several days. The current reading of the MACD represents a bearish signal that should be taken into account by contrarian traders.
The ongoing development of a Bearish Doji candle (from today) just below the upper Bollinger Band is indicative of rising selling pressure in the short term. However, this is not a decisive selling signal on its own.
Nevertheless, bears looking to enter short now on the expectations for a subsequent correction need to keep several targets for such a dropdown in mind.
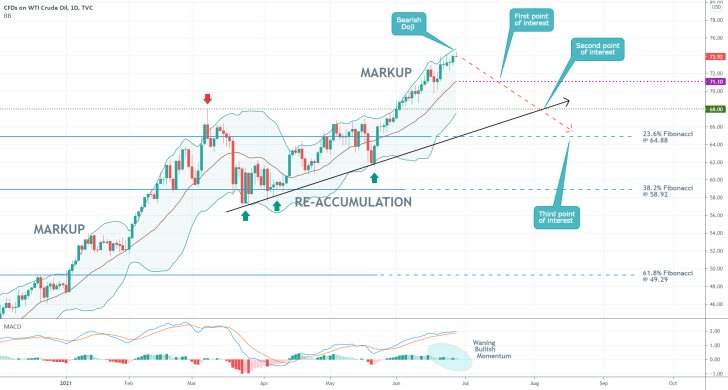
The closest target is the minor support level at 71.10. It is derived from the 20-day MA (the middle Bollinger Band). This represents the closest support level that could terminate a potential correction.
The second target level of interest can be found at 68.00. Its significance stems from the fact that it had previously served as a swing peak. It is, therefore, a major resistance-turned-support. The significance of the 68.00 support is further bolstered by the fact that the level is currently being crossed by the lower Bollinger Band. The latter serves as a floating support.
Once the price starts going down, it would also have to probe the ascending trend line (in black). The latter has already caused major rebounds on several occasions in the past.
If the correction proves to be even deeper than that, then the next target of interest can be found at the 23.6 per cent Fibonacci retracement level at 64.88. Being the closest retracement of the whole rally with psychological significance, this serves as the most substantial bullish barrier.
Having a Closer Look at the Last Upswing
Three additional Fibonacci retracements can be drawn on the 4H chart below in relation to the latest upswing. These are found within the peak of the uptrend and the aforementioned 23.6 per cent Fibonacci retracement at 64.88. They represent intermediate targets for the eventual bearish correction.
Notice that bearish sentiment is also rising in the short term. Once again, this is demonstrated by the MACD indicator, which underpins a potential Divergence in the making. This has been taking place since the 17th of June.
Around the same time, the price action started threading within the lower portion of the regression channel, which confirms the mounting bearish pressure.
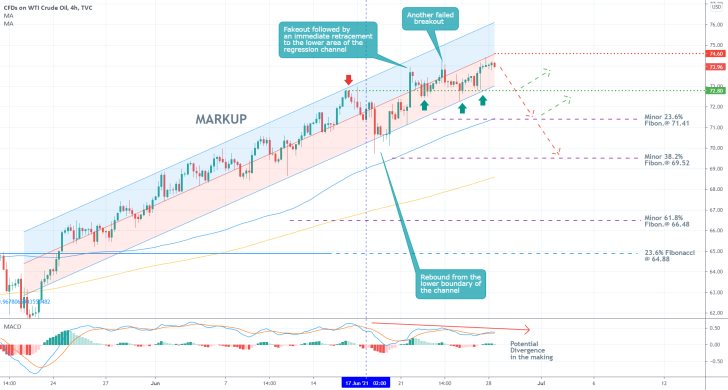
This is further substantiated by the fact that since then, the price has established a couple of failed breakouts within the upper portion of the channel. Therefore, there is plenty of evidence to underscore the gradually increasing selling pressure in the short term.
Bears should look to the resistance-turned-support level at 72.80 for more bearish confirmation. The latter is currently converging with the lower end of the channel, which makes it an even more important barrier.
If the price manages to break down below it, then it would be free to probe the minor 23.6 per cent Fibonacci at 71.41 and the minor 38.2 per cent Fibonacci at 69.52. The former is currently being crossed by the 100-day MA (in blue), while the latter is about to converge with the 200-day MA (in orange).
Meanwhile, the bearish risk area is underpinned by the 74.60 resistance level. This is highlighted by the middle line of the linear regression channel.
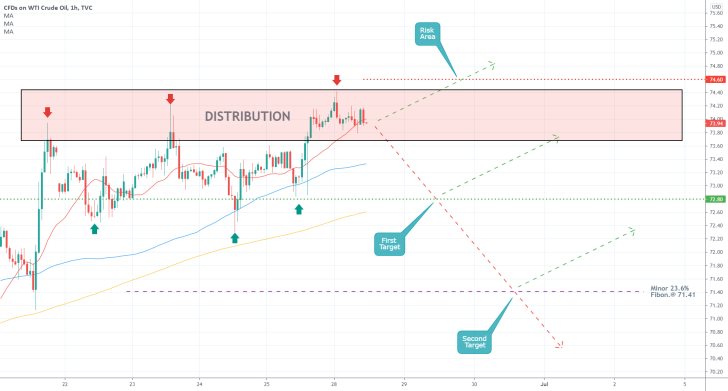
As shown on the hourly chart below, the transition of the price action - from having distinctly bullish to bearish sentiment - is likely to occur within the Distribution area. The latter is important for bears looking to sell around the current spot price.
Concluding Remarks:
As regards bulls, they do not have any good opportunities to go long around the current spot price. This is so because it is never a good idea to join an existing trend too late into its development. The best they can do is wait for the next correction to bottom out before they can join the uptrend at the resulting bottom.
In contrast, bears can join the market around the current price. However, they will be utilising contrarian trading strategies, which entail a high degree of risk. That is why the current opportunity is not suitable for risk-averse sellers.
Bears that decide to sell around the current market price need to place their stop-loss orders not very far away from 74.60. They will be targeting one of the aforementioned target levels.
If the price manages to break down below 72.80, bears can move their stop losses to breakeven. Alternatively, they can implement floating stop orders in order to squeeze the maximum out of a potentially deeper correction.
Waiting for a Breakout from Crude's Pennant
The price of crude oil has been consolidating over the past couple of days, which has led to the establishment of a Pennant pattern. This entails an eventual breakout at the end of the consolidation, thereby renewing directional trading.
The temporary consolidation is the result of low liquidity in the market, inspired by a relatively uneventful economic calendar. Trading activity has diminished since last week's OPEC meeting, which triggered the latest upswing.
This subdued sentiment is suitable for the implementation of trend continuation trading strategies. Case in point, bulls would have an opportunity to go long once the price manages to break away from this temporary consolidation range. The conditions are more suitable for bulls because the price of crude oil still finds itself in a robust bullish market.
The latter is inspired by a sizable pick-up in global economic activity.
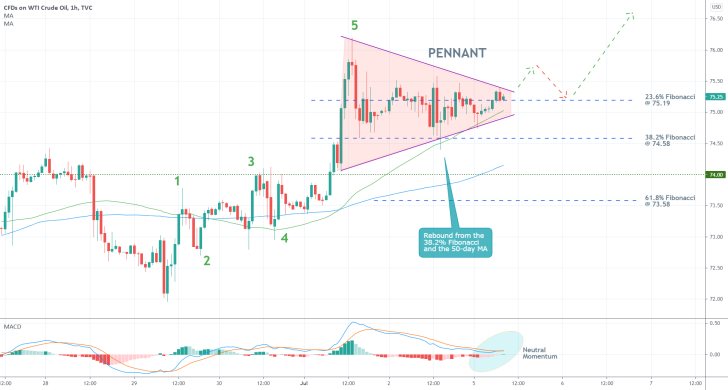
As can be seen on the hourly chart above, the latest upswing managed to penetrate above the major resistance level at 74.00. Its significance is derived from the fact that it had previously served as a major swing peak. Hence, it is now a prominent resistance-turned-support.
Moreover, the upswing took the form of a bullish 1-5 impulse wave pattern, as postulated by the Elliott Wave Theory. It is therefore unsurprising that a temporary consolidation structure followed the completion of said directional price action. In other words, the emergence of a Pennant following the completion of the 1-5 impulse wave pattern is quite logical.
That is why a breakout above the Pennant's upper boundary will serve as an indication that the market is ready to resume climbing higher. This is further substantiated by the fact that the price action is currently concentrated around the 23.6 per cent Fibonacci retracement level at 75.19. The absence of any major breakdowns (for the time being) is demonstrative of strong buying pressure around this support.
The only test of the 38.2 per cent Fibonacci retracement level at 74.58 was followed by a snap rebound from the 50-day MA (in green). That is why bulls should look for a decisive breakout from the currently emerging bottleneck - the narrowing of the Pennant towards its right end - as an indication that the price is ready to resume going north.
They could then place a tight stop-loss order just below the 23.6 per cent Fibonacci, while keeping in mind that there is a high probability for a subsequent throwback to said support level. This is indicated on the chart above.
While there is a slim chance for a deeper bearish correction towards 74.00 taking place before the bullish trend can be resumed, bears should be extra cautious if they plan to trade on this opportunity. This would involve the implementation of contrarian trading strategies, which would be extremely dangerous given the ostensibly bullish sentiment that prevails in the long term.
Nearing the End of Crude's Pullback
The price of crude oil recuperated some of its recent losses yesterday as it established a sizable pullback. The short term hike was initiated as the European Central Bank announced its new monetary policy strategy. Energy demand grew as the ECB announced it would pursue inflation at the symmetric 2.0 per cent level, meaning it will no longer accept any deviations from said level.
Even still, crude's overarching bearish sentiment remains prevalent. This is further bolstered by the low levels of market liquidity, which are caused by the relatively uneventful week on the market.
This relatively subdued outlook on the market is suitable for the implementation of trend continuation trading strategies. In particular, bears can look for an opportunity to enter short, provided that the next swing peak is lower than the one preceding it.
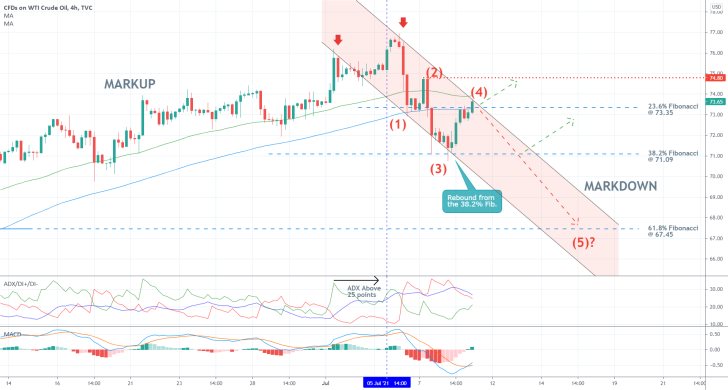
The bearish reversal occurred from the 77.00 price level, as indicated on the price 4H chart above. The new downtrend appears to be taking the form of a 1-5 impulse wave pattern, as postulated by the Elliott Wave Theory. It is represented as a descending channel.
The present pullback thus serves the role of a second retracement leg (3-4), and bears would have a chance to enter short at the top of point 4. That is if the peak at 4 is lower than the peak at point 2 (74.80).
It is interesting to point out that the second retracement leg was initiated after the rebound from the 38.2 per cent Fibonacci retracement level at 71.09. The price action is currently probing the 23.6 per cent Fibonacci at 73.35, which could end up serving as a turning point. That is why bears should start looking for likely reversals in the very near future.
Another reason to expect such a turn of events has to do with the fact that the price action is currently probing the 100-day MA (in blue) and the 50-day MA (in green) from below. Both of these moving averages serve as floating resistances.
The strength of the newly emerging downtrend is elucidated by the Stochastic RSI indicator, which has been threading above the 25-point benchmark since the 5th of July. The underlying momentum, too, remains ostensibly bearish, as underpinned by the MACD indicator.
If the price action reverses from the 23.6 per cent Fibonacci retracement level, the next impulse leg (4-5) is likely to fall towards the 61.8 per cent Fibonacci at 67.45.
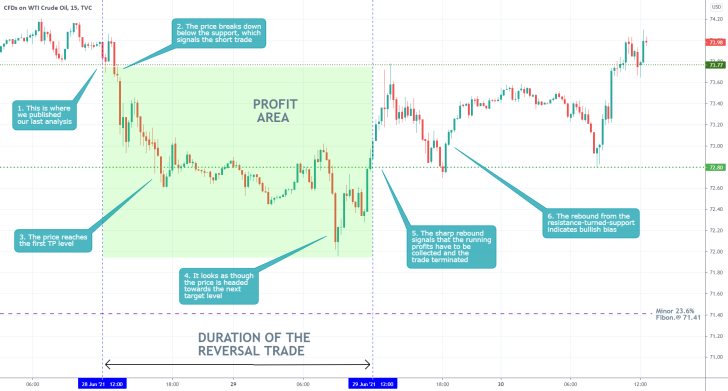
- Our last analysis of crude oil successfully forecasted the emergence of a bearish correction towards 72.80 (the first target level). However, the price did not go on to sink towards the next targets, the possibility of which was also underpinned by the analysis.
- This represents a good example of why traders need to move their stop orders after the price action has already moved by a significant margin in their favour. That way, they can protect their running profits against such sharp changes in the underlying direction of the price action.
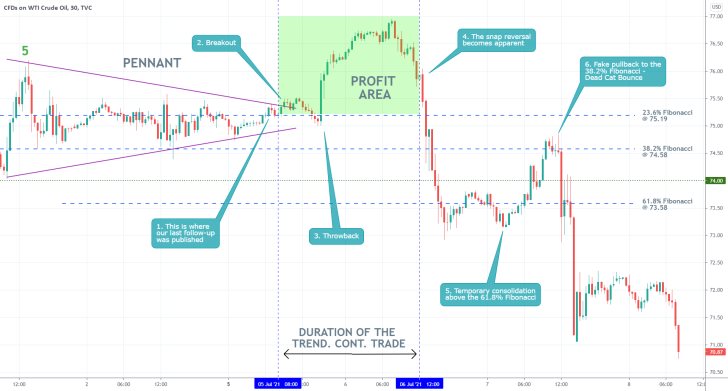
- Our last follow-up analysis of crude oil managed to catch the last of the existing bullish trend. A successful trend continuation trade was executed following the expected breakout above the Pennant. Additionally, a throwback to the 23.6 per cent Fibonacci after the breakout was also successfully projected.
- The snap bearish reversal from the new swing peak underpinned the long-awaited (by the initial analysis) emergence of a new massive bearish correction. It is interesting to point out the manner in which the price action bounced between the various Fibonacci retracement levels after the correction started developing.
- This snap reversal elucidates why it is so important for traders to use trend continuation trading strategies to implement floating stop orders. That way they can catch the most out of an existing trend while also protecting themselves against such sudden changes in the underlying direction of the price action.
Disclaimer: Your capital is at risk! Trading and investing on the financial markets carries a significant risk of loss. Each material, shown on this website, is provided for educational purposes only. A perfect, 100% accurate method of analysis does not exist. If you make a decision to trade or invest, based on the information from this website, you will be doing it at your own risk. Under no circumstances is Trendsharks responsible for any capital losses or damages you might suffer, while using the company’s products and services. For more information read our Terms & Conditions and Risk Disclaimer.


