The coronavirus outbreak is ravaging Europe, and for the time being, the now fewer reported cases in Italy – the hardest-hit country by the epidemic in the EU – offers one of the only few glimmers of hope that the situation can soon be resolved. Deaths keep mounting at different paces in all European countries, with the fatality rate in Spain reaching 1000 casualties per day. In the meantime, the number of worldwide confirmed cases topped 1 million yesterday, which is a psychological barrier.
Governments are attempting to cut the virus’ rate of spreading by imposing national lockdowns, which, unfortunately, are exerting a heavy toll on their economies as well as on global supply chains. In the midst of all of these economic ripples, the German economy, which is the biggest in the Eurozone, became one of the hardest-hit in the European bloc.
Because of its considerable economic capacity, Germany has taken the brunt of the initial shock in the Eurozone, and it’s now leading the monumental task of stabilising the economic situation there. Chiefly, to mitigate the negative impact of COVID-19 on the already-distorted financial systems in the euro-area, and to ensure their survival.
Yesterday it was announced that Germany is forecasting a contraction in its Gross Domestic Product by a margin of more than 8 per cent in some months of the first quarter, which is underscoring concerns of a new deep recession. At present, financial analysts are cautioning that the economic prospects look gloomier than the aftermath of the 2008 credit crunch.
The rippling effect stemming from these recent developments is already affecting the German stock market negatively, with the DAX index contracting more than 20 per cent in little over a month. Naturally, the future of the index can unfold in one of two ways. The German fiscal stimulus in conjunction with ECB’s liquidity policy could mitigate the negative impact of the economic fallout and thereby stabilise the stock market. Conversely, the situation could continue to deteriorate and subsequently push the DAX further south. That is why the purpose of today's analysis is to evaluate the underlying market conditions and to examine how these scenarios could potentially pan out.
1. Long Term Outlook:
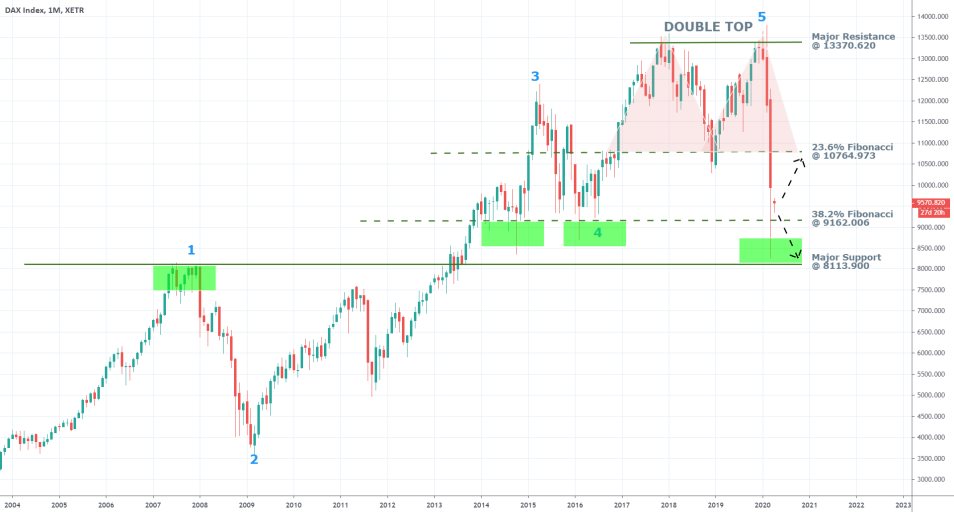
As can be seen on the monthly chart below, the DAX had reached a solid peak just before the market started to crash in February. The price had reached the historic resistance level at 13370.620 in November 2019, which has never been successfully broken. Since then, the DAX has been consolidating just below it, thereby creating the Double Top pattern represented on the chart below.
In that sense, once the DAX started to plummet in the wake of the coronavirus outbreak in Europe, the market rout served as a catalyst for the completion of this inherently bearish pattern. Such patterns are typically found at the end of a recent bullish trend/market, and entail the termination of the bullish sentiment’s prevalence. In other words, the price action on the DAX is likely to either consolidate around the dip that was recently reached, or last month’s downswing could be the beginning of a new major bearish trend. The question is how to distinguish between the two?

Elliott Wave Theory can be applied to confirm the now complete termination of the previous bullish trend. As can be seen, the 1-5 impulse pattern’s development was finished once the price action reached a peak at the aforementioned resistance level. Even though the bullish trend is now completed, its former peaks and bottoms (1-5) can be used as key indicators of crucial support and resistance levels. Hence, the behaviour of the price action around these levels is going to be illustrative of the new market sentiment’s nature. In other words, the price’s behaviour around these levels is going to be an indication of whether the DAX index is headed for a long term consolidation, or is it entering into a new bearish trend.
If the ECB’s monetary policy and Germany’s rigid fiscal policy prove sufficient, and the index starts consolidating before a new bullish market can emerge, then this is likely to take place within the boundaries of a range. Its upper edge is most likely to be the resistance level at 10764.973. The prominence of this level is confirmed by the fact that it is also the 23.6 per cent Fibonacci retracement level. Additionally, it served as the 'Neckline' of the Double Top pattern.
For the range’s lower boundary there are two prime candidates. The first is naturally the 38.2 per cent Fibonacci retracement at 9162.006. The level was also established as a prominent support when the 3-4 pullback of the previous bullish trend reached a bottom there. The other candidate for a range’s lower boundary is the major support level at 8113.900. This level served as a peak for the first impulse leg of the previous bullish trend.
If, however, the price manages to break down below that second support level, the market would then become ostensibly bearish. The accumulating bearish sentiment would become quite robust, and the market would then decidedly start developing a new markdown. Under such a scenario, the current relief package that is extended by the German government would be proven insufficient in mitigating the economic fallout, and the stock market’s behaviour as described above would be a clear indication of that.
2. The German Economy Needs Sustained Help:
As it was mentioned above, the government in Germany already announced the most significant stimulus package in the Eurozone, amounting to a barrage of more than 750 billion euros. Meanwhile, the country's Economy Minister Peter Altmaier urged for more sustained help yesterday:
“[…] after 10 years of good economic growth we will again experience a recession this year. It’s the first since 2009, and we want it to be a temporary one and that it’s quickly put behind us and the economy emerges stronger. […] The GDP decline in the year overall could be bigger than during the 2009 financial crisis. There is a good chance for some economic growth next year. We will need not just one-off support but a broad stimulus package on which the government is currently working.”
What the German Economy Minister is alluding to is the so-called “V”-shaped recovery, or the more gradual “U”-shaped recovery. Both of these scenarios entail the bounce back up of the underlying economic activity once the market rout reaches a bottom. This prognosis is essentially supported by the expectation of quick stabilisation once the outbreak is handled. In other words, once the epidemic in Germany surpasses its peak and people are allowed to return to their workplaces, the economic activity would return to normal.
It is in the manner in which this perceived bottom develops that the midterm future of the DAX would depend on. In other words, the eventual recovery, particularly in the stock market, would depend on whether the anticipated bottom occurs as a sudden pullback, or a more gradual fizzling out of the bearish sentiment.
A V-shaped recovery would resemble a quick pullback to the aforementioned resistance at the 23.6 per cent Fibonacci retracement level. This can only happen if the German workforce returns back to the labour market relatively quickly – before the end of May at any rate.
In contrast, a U-shaped recovery would be a much more gradual process. The price of the index could continue to fall to either of the two aforementioned support levels before the bullish momentum gradually starts to pick up steam. Under such a scenario, the overall economic activity would likely begin to normalise towards the end of Q3 at the earliest. Thereby, an upswing to the 23.6 per cent Fibonacci retracement would be unlikely to occur by the end of the year under a U-turn recovery.
3. Short Term Outlook:
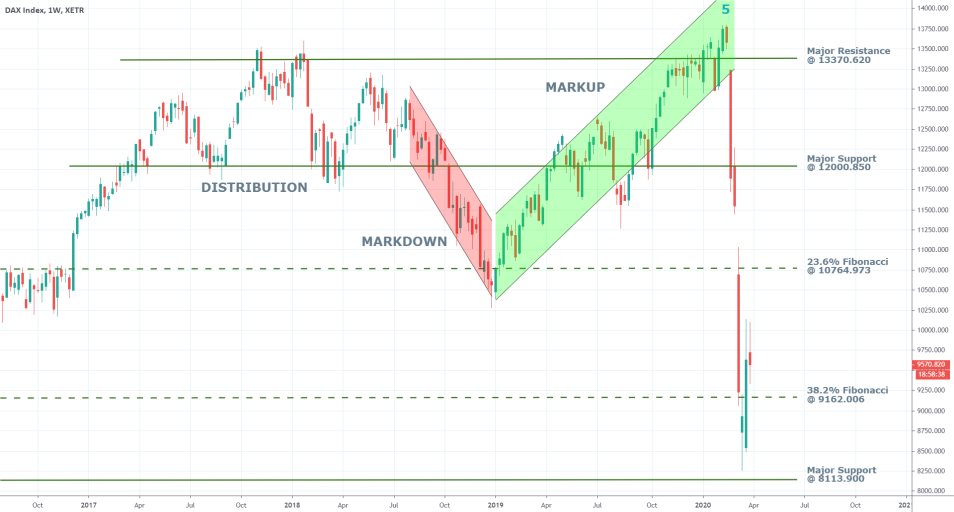
The weekly chart below highlights one particular aspect regarding the recent selloff. The market rout is not completely erratic in the sense that the significance of the prominent support and resistance levels can still be observed.

The opening and closing prices of the candlesticks are mostly occurring around these levels, which is indicative of still-existing buying and selling pressures at play. In that regard, the stock market rout was not completely uncontrolled, which sparks hope for the eventual recovery. Consequently, the execution of even more market orders can be expected to take place around these levels, which, in turn, is going to make the existing market pressures even more pronounced.
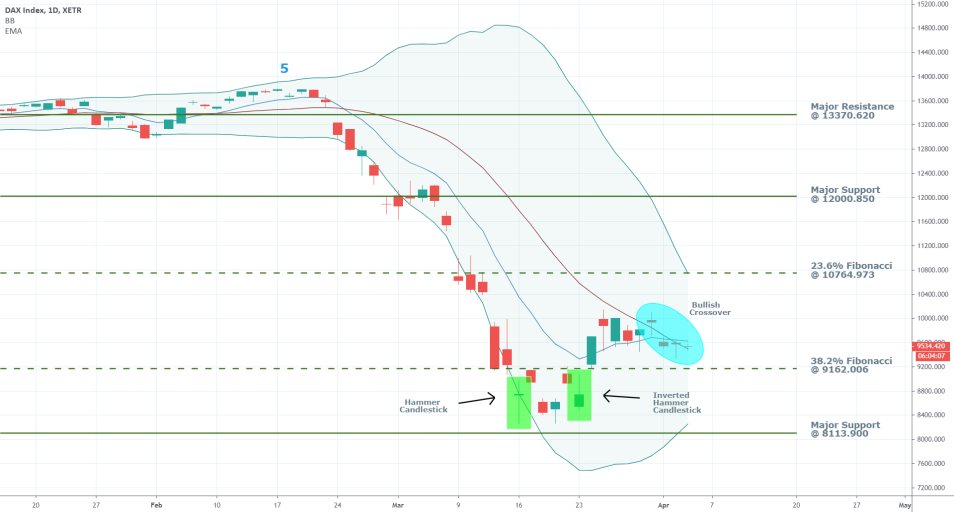
As can be seen on the daily chart below, the price action has formed two distinctive candlesticks around the dip that was reached recently. The one hammer and one inverted hammer both illustrate waning bullish momentum, which could be a precursor for a subsequent reversal in the price action’s direction.
The recent bullish correction has noticeably reached the middle line of the Bollinger Bands and has since then been consolidating just below it. Unless the price manages to break out above it, this behaviour will favour the continuation of the markdown's development in the midterm.
The Bollinger Bands are becoming noticeably narrower, which is exhibitive of the waning adverse volatility in the market. This is welcoming news for the market bulls who are now weighing on stabilisation of the market. The last positive sign is the 10-day EMA surpassing the middle line of the BB, which is illustrative of increasing bullish momentum in the short term.


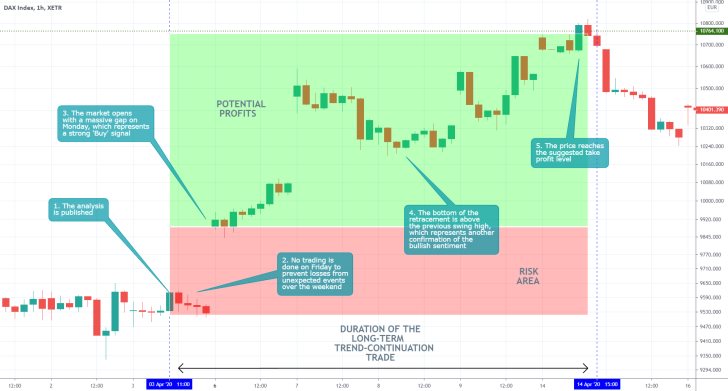
- The analysis and the trade were both quite successful. Not much do be said here except that indices are typically quite expensive assets, which means that traders with small accounts should not trade them. That is so because each thick movement is going to have a much bigger impact on their margin requirements.
Disclaimer: Your capital is at risk! Trading and investing on the financial markets carries a significant risk of loss. Each material, shown on this website, is provided for educational purposes only. A perfect, 100% accurate method of analysis does not exist. If you make a decision to trade or invest, based on the information from this website, you will be doing it at your own risk. Under no circumstances is Trendsharks responsible for any capital losses or damages you might suffer, while using the company’s products and services. For more information read our Terms & Conditions and Risk Disclaimer.


