The current trend of recuperating crude oil prices could be jeopardised by the growing shale sector in the US, whose expansion outpaces the stabilisation between the supply and demand pressures of the broader energy market.
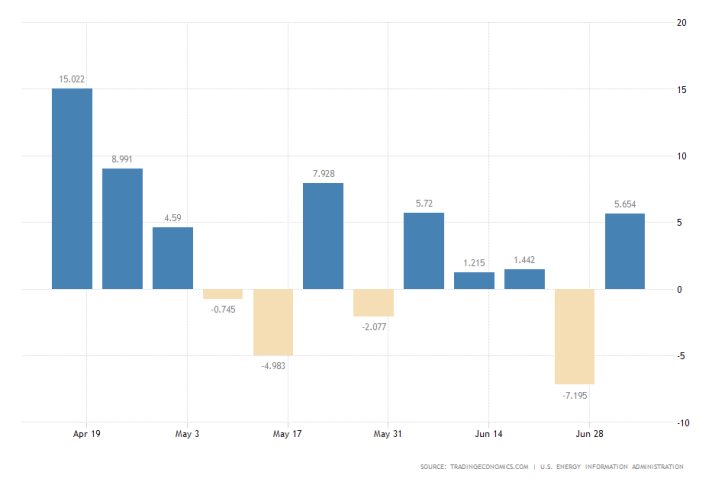
Yesterday, the Energy Information Administration released its newest issue of the Crude Oil Inventories in the US.
The consensus forecasts expected a sizable contraction of 3.2 million barrels; however, the data showed a marked expansion of the reserve by an additional 5.7 million barrels.

"U.S. commercial crude oil inventories (excluding those in the Strategic Petroleum Reserve) increased by 5.7 million barrels from the previous week. At 539.2 million barrels, U.S. crude oil inventories are about 18% above the five year average for this time of year."
The period between July and August is typically characterised by low demand for crude due to weak economic activity. This year the situation is especially sensitive because of the pandemic, which continues to weigh down on aggregate demand.
Global demand for oil continues to be quite subdued, and even small ripples in the fragile supply and demand equilibrium could send shockwaves in the broader energy market.
The inventories data from yesterday illustrates these concerns as the supply in the US outpaces the growth in demand. Consequently, crude's tentative bullish run that originated in the wake of the recent slump could be impeded if this trend is allowed to persist.
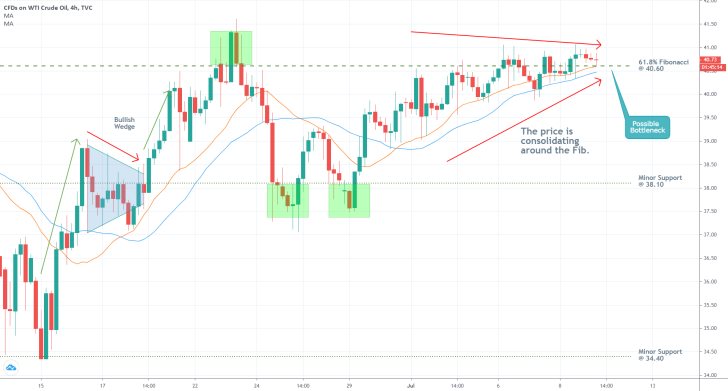
As can be seen on the 4H chart below, the price of crude oil continues to consolidate around the pivotal 61.8 per cent Fibonacci retracement level at 40.60.
For the time being, the underlying price action fails to advance further north despite having broken out above the resistance. While this behaviour does not necessarily entail an emerging trend reversal, it could manifest potentially growing selling pressure in the market.
If traders weigh in on the recent developments in the energy market as signals for a new major change in the underlying supply and demand equilibrium, this selling pressure could be exacerbated in the following days.
For the time being, the 20-day MA (in orange) threads above the 30-day MA (in blue), which confirms the prevalence of the bullish momentum in the short-term.
However, if the price action falls below the 61.8 per cent Fibonacci retracement with a decisive breakdown, the next support level could be found at the 38.10 price level.
If the expansion of the global oil supply continues to exceed the still moderate growth of aggregate demand, the market could form another bearish correction of 2-4 dollars by the middle of the month.

Trendsharks Premium
Gold is undergoing a correction, as investors take profits to offset losses from falling stock prices, impacting their margins. However, we anticipate a renewed wave of [...]
The Swiss stock market index is mirroring its global counterparts, such as Germany 40 and US100, experiencing a sharp decline following the announcement of new [...]
We’re analyzing the weekly chart to grasp the broader market trend. Over the past three years, the US30 index has surged by 17,000 points, often resembling a nearly straight [...]
Over the past week, the DAX has experienced a sharp decline, plunging by an astonishing 3,400 points. This downward movement is not isolated, as its international counterparts, such as the UK100 and US100, are also facing significant [...]
EURUSD recently formed a double top at 1.0930, signaling a potential trend reversal, and has since begun a correction. After a 600-pip rally since early March, a pullback at this stage is both expected and healthy. Given these conditions, we are placing a [...]
Since early March, EURJPY has surged nearly 1,000 pips, providing us with several excellent trading opportunities. However, as the rally matures, many early buyers are beginning to take profits, leading to a noticeable slowdown in the uptrend. On Friday, the pair formed a [...]
The AUDJPY currency pair continues to be dominated by bullish momentum, as multiple golden cross patterns reaffirm the strength of the ongoing uptrend. Despite this, we are witnessing a much-needed [...]
The EURAUD currency pair appears to be undergoing a trend reversal, signaling a potential shift in market direction. A notable technical development is the formation of a Death Cross on the chart, a widely recognized bearish indicator that typically suggests a [...]
After securing an impressive 200-pip profit last week, the EURJPY currency pair is now undergoing a southward correction, retracing some of its recent gains. Despite this temporary pullback, the Golden Cross remains intact, reinforcing our view that the overall trend continues to be [...]
The appearance of a Golden Cross in Silver strengthens our analysis that the metal is currently in a strong uptrend, indicating further bullish momentum in the market. This technical pattern, where the short-term moving average crosses above the [...]
This trade presents a considerable level of risk and can be classified as an opportunistic move based on recent price action. The GBPUSD currency pair has experienced a substantial bullish rally, surging by nearly 500 pips in a strong upward movement. However, after this extended period of appreciation, the pair is showing signs of a potential [...]
The anticipated Death Cross on the SMI20 appears to be failing as price finds strong support at the 23% Fibonacci retracement level. After testing this area, the index has shown bullish strength, printing several large green candles, signaling an increase in [...]
A Golden Cross has just appeared on the USDJPY chart, signaling a potential bullish move. This technical pattern occurs when the 20 period moving average crosses above the 60 period moving average, a widely recognized indication of increasing [...]
After 2 months of a down trend, we finally see some indications of price recovery for Oil. The golden cross, a historic buy signal, supports this [...]
For the past month, the German DAX40 has experienced a remarkable 10% surge, reflecting strong bullish momentum. Despite ongoing market volatility and frequent pullbacks, every dip continues to attract fresh buyers, reinforcing the [...]
Oil continues its downward trajectory, despite occasional pullbacks. The overall trend remains bearish, reinforced by multiple Death Cross patterns, a classic sell signal indicating further weakness. Adding to this bearish outlook, the critical [...]
Over the past few days, gold has experienced a sharp decline of more than $100. This downturn can be attributed in part to traders securing profits to manage their margins, which are under strain due to the significant drop in major indices. Currently, gold has fallen below the [...]
The NASDAQ 100 index is showing strong bullish momentum, as evidenced by the formation of a Golden Cross on the chart. This classic buy signal occurs when the short moving average crosses above the long term moving average, suggesting that upward momentum is [...]
The EURAUD currency pair has encountered a significant resistance level, failing to break above the critical 61% Fibonacci retracement level. This suggests that bullish momentum is weakening, reinforcing the case for a potential downward move. Given this technical setup, we favor entering a [...]
The UK100 is experiencing a remarkable rally! Over the past few weeks, the British stock market index has surged nearly 800 points. Each minor dip has attracted more buyers, fueling the bullish momentum. However, since last week, we’ve observed a slight [...]


