This week's trading session began with a massive barrage of selling pressure on the commodity as talks of FED tapering exacerbated gold's current woes. Our latest comprehensive analysis of gold delineates further on the underlying market sentiment.
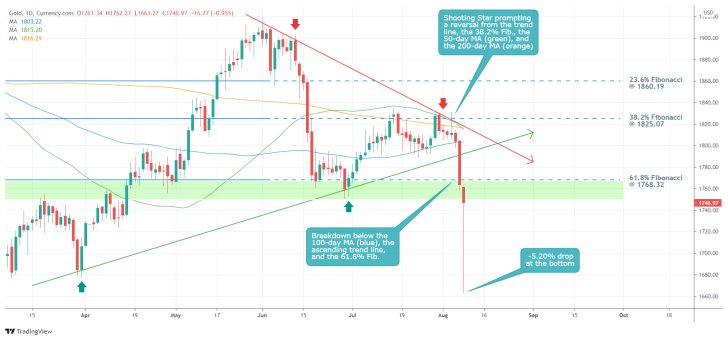
A gold flash crash was observed today during the Asian trading session, as the commodity's price had at one point sunk more than $100 (5.20 per cent). The price was then able to recover most of the losses, even though bearish pressure continues to be considerable.
Gold was battered as talks of FED tapering the scale of its asset purchases began last Friday after the July employment numbers crushed the initial forecasts. With the labour market recuperating faster than anticipated and inflation growth expected to match FED's projections, there is a solid case to be made in favour of monetary tightening.

So far, the flash crash is resulting in the creation of a Hammer Candle, as shown on the daily chart above. The rebound emerged after the price had sunken to the previous swing low at around 1680.0.
The price action is currently concentrated within the major Support Area (in green), positioned just below the 61.8 per cent Fibonacci retracement level at 1768.32. The latter represents the last Fibonacci threshold, which is why the immediate behaviour of the price action would be demonstrative of where the market would go next.
If the price manages to get back above 1768.32 within the next several days, this could be signifying that the market has managed to recoup from the initial shock of the flash crash. Conversely, prolonged consolidation below this make-it-or-break-it threshold would likely be demonstrative of sustained selling pressure and further losses.
Notice that the current downtrend commenced following the emergence of a Shooting Star candle (signifying bearish bias) from the 38.2 per cent Fibonacci at 1825.07. Breakdowns below the 50-day MA, the 200-day MA, the 100-day MA, the ascending trend line (in green) and the 61.8 per cent Fibonacci ensued. All of these factors underpin the strong selling pressure that prevails at the present moment.
July's non-farm payrolls prompted talks of FED tapering the underlying QE programs
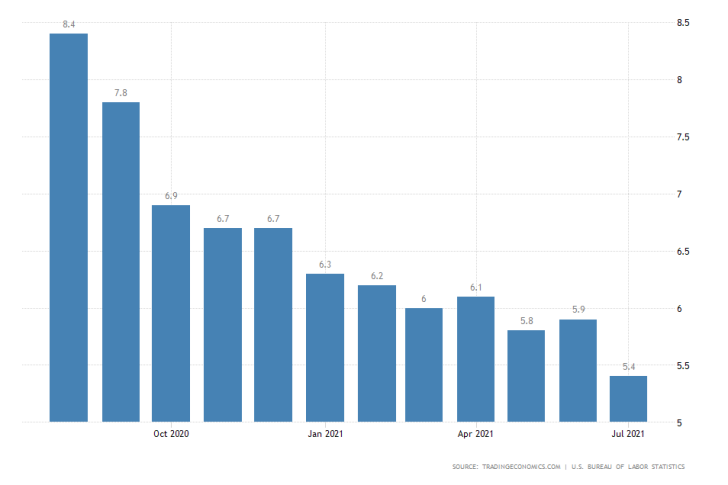
Last Friday, the Bureau of Labour Statistics (BLS) in the U.S. published the July non-farm payrolls. The employment numbers absolutely crushed the initial forecasts as it was revealed that headline unemployment had contracted to 5.4 per cent vs 5.7 per cent expected.

With the faster-than-expected rate of employment growth, more and more market participants are now starting to weigh in on a possible FED tightening before the initially announced 2023 deadline.
This is causing the dollar to strengthen while the price of the safe-haven gold decreases.
Trendsharks Premium
Gold is undergoing a correction, as investors take profits to offset losses from falling stock prices, impacting their margins. However, we anticipate a renewed wave of [...]
The Swiss stock market index is mirroring its global counterparts, such as Germany 40 and US100, experiencing a sharp decline following the announcement of new [...]
We’re analyzing the weekly chart to grasp the broader market trend. Over the past three years, the US30 index has surged by 17,000 points, often resembling a nearly straight [...]
Over the past week, the DAX has experienced a sharp decline, plunging by an astonishing 3,400 points. This downward movement is not isolated, as its international counterparts, such as the UK100 and US100, are also facing significant [...]
EURUSD recently formed a double top at 1.0930, signaling a potential trend reversal, and has since begun a correction. After a 600-pip rally since early March, a pullback at this stage is both expected and healthy. Given these conditions, we are placing a [...]
Since early March, EURJPY has surged nearly 1,000 pips, providing us with several excellent trading opportunities. However, as the rally matures, many early buyers are beginning to take profits, leading to a noticeable slowdown in the uptrend. On Friday, the pair formed a [...]
The AUDJPY currency pair continues to be dominated by bullish momentum, as multiple golden cross patterns reaffirm the strength of the ongoing uptrend. Despite this, we are witnessing a much-needed [...]
The EURAUD currency pair appears to be undergoing a trend reversal, signaling a potential shift in market direction. A notable technical development is the formation of a Death Cross on the chart, a widely recognized bearish indicator that typically suggests a [...]
After securing an impressive 200-pip profit last week, the EURJPY currency pair is now undergoing a southward correction, retracing some of its recent gains. Despite this temporary pullback, the Golden Cross remains intact, reinforcing our view that the overall trend continues to be [...]
The appearance of a Golden Cross in Silver strengthens our analysis that the metal is currently in a strong uptrend, indicating further bullish momentum in the market. This technical pattern, where the short-term moving average crosses above the [...]
This trade presents a considerable level of risk and can be classified as an opportunistic move based on recent price action. The GBPUSD currency pair has experienced a substantial bullish rally, surging by nearly 500 pips in a strong upward movement. However, after this extended period of appreciation, the pair is showing signs of a potential [...]
The anticipated Death Cross on the SMI20 appears to be failing as price finds strong support at the 23% Fibonacci retracement level. After testing this area, the index has shown bullish strength, printing several large green candles, signaling an increase in [...]
A Golden Cross has just appeared on the USDJPY chart, signaling a potential bullish move. This technical pattern occurs when the 20 period moving average crosses above the 60 period moving average, a widely recognized indication of increasing [...]
After 2 months of a down trend, we finally see some indications of price recovery for Oil. The golden cross, a historic buy signal, supports this [...]
For the past month, the German DAX40 has experienced a remarkable 10% surge, reflecting strong bullish momentum. Despite ongoing market volatility and frequent pullbacks, every dip continues to attract fresh buyers, reinforcing the [...]
Oil continues its downward trajectory, despite occasional pullbacks. The overall trend remains bearish, reinforced by multiple Death Cross patterns, a classic sell signal indicating further weakness. Adding to this bearish outlook, the critical [...]
Over the past few days, gold has experienced a sharp decline of more than $100. This downturn can be attributed in part to traders securing profits to manage their margins, which are under strain due to the significant drop in major indices. Currently, gold has fallen below the [...]
The NASDAQ 100 index is showing strong bullish momentum, as evidenced by the formation of a Golden Cross on the chart. This classic buy signal occurs when the short moving average crosses above the long term moving average, suggesting that upward momentum is [...]
The EURAUD currency pair has encountered a significant resistance level, failing to break above the critical 61% Fibonacci retracement level. This suggests that bullish momentum is weakening, reinforcing the case for a potential downward move. Given this technical setup, we favor entering a [...]
The UK100 is experiencing a remarkable rally! Over the past few weeks, the British stock market index has surged nearly 800 points. Each minor dip has attracted more buyers, fueling the bullish momentum. However, since last week, we’ve observed a slight [...]


