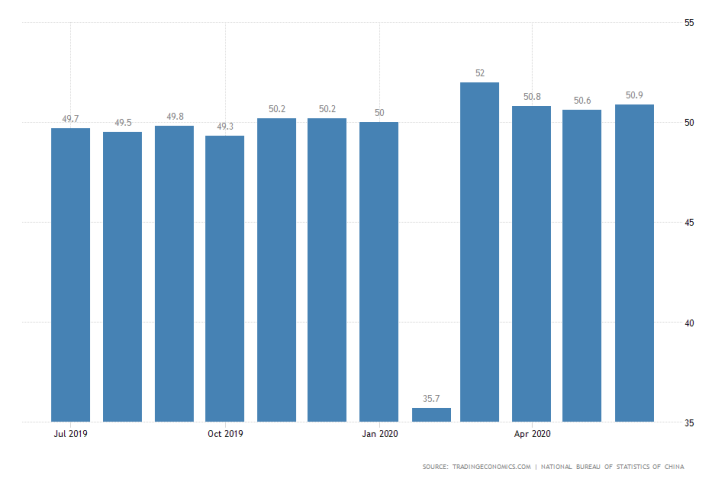
The Official NBS Manufacturing PMI Index beat the initial estimations for June, which exhibits growth in aggregate demand and expansion of the Chinese industry. Both of these factors are necessary prerequisites for global economic recovery.
The index recuperated to 50.9 points towards the end of the second quarter after it had previously depreciated for two consecutive months. The final results surpassed the consensus forecasts by 0.5 index points.

The factory activity report demonstrated robust improvement in output, the most in three months, coupled with steady growth in new orders for the fourth consecutive month.
The recorded data manifested solid performances in all aspects connected to manufacturing, which is welcoming news after the Chinese government decided to lift most of its stringent lockdowns.
The observed stabilisation of Chinese manufacturing underlines growth in global demand as more and more countries ease their own restrictions. These promising numbers also underscore the pickup of global economic activity, which favours a U-Shaped recovery.
Nevertheless, if a severe second wave were to hit and prompt new series of lockdowns across the world, this could incite a further economic slump.
Essentially, the Chinese manufacturing index represents a gauge, which could be used by economists and policymakers to discern the most likely type of recovery. As of now, two baseline scenarios seem most probable – a smoothed U-Shaped recovery contrasted against a protracted W-Shaped recovery.
Meanwhile, the Chinese Yuan was momentarily strengthened immediately following the manufacturing data's publication. It has advanced by 0.20 per cent against the greenback so far during today's trading session.
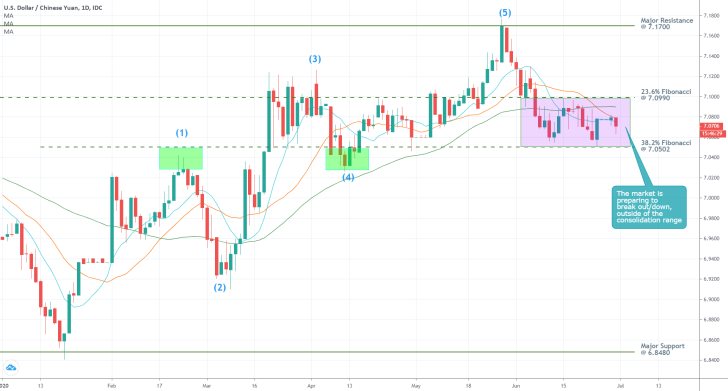
As can be seen on the daily chart below, the USDCNY remains confined within a narrow consolidation range. The latter has the 23.6 per cent Fibonacci retracement level at 7.0990 as its upper boundary, and the 38.2 per cent Fibonacci retracement level at 7.0502 as its lower boundary.
The pair looks set to attempt breaking outside of the range's territory in the next several days. The expected softening in demand for the greenback could prompt the underlying price action to attempt breaking down below the range's lower limit next.
These projections are presently supported by the fact that the price action remains concentrated below the 10-day MA (in blue) as well as the 20-day MA (in orange).
Additionally, the bullish 1-5 impulse wave pattern is now decidedly concluded, which would potentially allow for the formation of a new bearish trend. That is if the underlying fundamentals remain favourable.

Trendsharks Premium
Gold is undergoing a correction, as investors take profits to offset losses from falling stock prices, impacting their margins. However, we anticipate a renewed wave of [...]
The Swiss stock market index is mirroring its global counterparts, such as Germany 40 and US100, experiencing a sharp decline following the announcement of new [...]
We’re analyzing the weekly chart to grasp the broader market trend. Over the past three years, the US30 index has surged by 17,000 points, often resembling a nearly straight [...]
Over the past week, the DAX has experienced a sharp decline, plunging by an astonishing 3,400 points. This downward movement is not isolated, as its international counterparts, such as the UK100 and US100, are also facing significant [...]
EURUSD recently formed a double top at 1.0930, signaling a potential trend reversal, and has since begun a correction. After a 600-pip rally since early March, a pullback at this stage is both expected and healthy. Given these conditions, we are placing a [...]
Since early March, EURJPY has surged nearly 1,000 pips, providing us with several excellent trading opportunities. However, as the rally matures, many early buyers are beginning to take profits, leading to a noticeable slowdown in the uptrend. On Friday, the pair formed a [...]
The AUDJPY currency pair continues to be dominated by bullish momentum, as multiple golden cross patterns reaffirm the strength of the ongoing uptrend. Despite this, we are witnessing a much-needed [...]
The EURAUD currency pair appears to be undergoing a trend reversal, signaling a potential shift in market direction. A notable technical development is the formation of a Death Cross on the chart, a widely recognized bearish indicator that typically suggests a [...]
After securing an impressive 200-pip profit last week, the EURJPY currency pair is now undergoing a southward correction, retracing some of its recent gains. Despite this temporary pullback, the Golden Cross remains intact, reinforcing our view that the overall trend continues to be [...]
The appearance of a Golden Cross in Silver strengthens our analysis that the metal is currently in a strong uptrend, indicating further bullish momentum in the market. This technical pattern, where the short-term moving average crosses above the [...]
This trade presents a considerable level of risk and can be classified as an opportunistic move based on recent price action. The GBPUSD currency pair has experienced a substantial bullish rally, surging by nearly 500 pips in a strong upward movement. However, after this extended period of appreciation, the pair is showing signs of a potential [...]
The anticipated Death Cross on the SMI20 appears to be failing as price finds strong support at the 23% Fibonacci retracement level. After testing this area, the index has shown bullish strength, printing several large green candles, signaling an increase in [...]
A Golden Cross has just appeared on the USDJPY chart, signaling a potential bullish move. This technical pattern occurs when the 20 period moving average crosses above the 60 period moving average, a widely recognized indication of increasing [...]
After 2 months of a down trend, we finally see some indications of price recovery for Oil. The golden cross, a historic buy signal, supports this [...]
For the past month, the German DAX40 has experienced a remarkable 10% surge, reflecting strong bullish momentum. Despite ongoing market volatility and frequent pullbacks, every dip continues to attract fresh buyers, reinforcing the [...]
Oil continues its downward trajectory, despite occasional pullbacks. The overall trend remains bearish, reinforced by multiple Death Cross patterns, a classic sell signal indicating further weakness. Adding to this bearish outlook, the critical [...]
Over the past few days, gold has experienced a sharp decline of more than $100. This downturn can be attributed in part to traders securing profits to manage their margins, which are under strain due to the significant drop in major indices. Currently, gold has fallen below the [...]
The NASDAQ 100 index is showing strong bullish momentum, as evidenced by the formation of a Golden Cross on the chart. This classic buy signal occurs when the short moving average crosses above the long term moving average, suggesting that upward momentum is [...]
The EURAUD currency pair has encountered a significant resistance level, failing to break above the critical 61% Fibonacci retracement level. This suggests that bullish momentum is weakening, reinforcing the case for a potential downward move. Given this technical setup, we favor entering a [...]
The UK100 is experiencing a remarkable rally! Over the past few weeks, the British stock market index has surged nearly 800 points. Each minor dip has attracted more buyers, fueling the bullish momentum. However, since last week, we’ve observed a slight [...]


