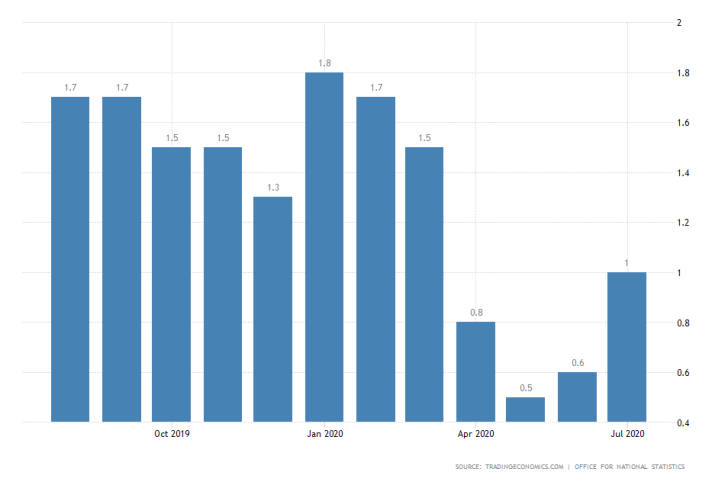
The Consumer Price Index in the UK rose to 1 per cent in July on a yearly basis, as reported by the Office for National Statistics. The recorded performance exceeded the consensus forecasts anticipating the CPI index to remain unchanged at 0.6 per cent from its June reading.

The sudden spike in consumer price is attributed to higher energy prices and the spillover effect this had on other goods and services. Additionally, the easing of some Government restrictions last month contributed to higher consumer spending rates.
Despite this welcoming development, however, inflation is expected to drop next month due to a projected fall of energy prices.
Moreover, the resurgence of COVID-19 cases threatens the tentative recovery of the underlying consumer sentiment. The reintroduction of stricter containment measures could further propel the British economy towards entering structural deflation.
Even if this proves to be only a temporary spike in consumer prices, it still represents a much-needed respite for the reeling British economy, which recently registered its biggest quarterly contraction on record.
The short-lived positive trend is likely to be further bolstered this week when the Markit institute publishes the highly-anticipated industry numbers for August.
According to the prevailing market forecasts, the British economy is anticipated to lift off from this historic slump by generating marginal improvements in the two most significant industrial sectors - manufacturing and services.
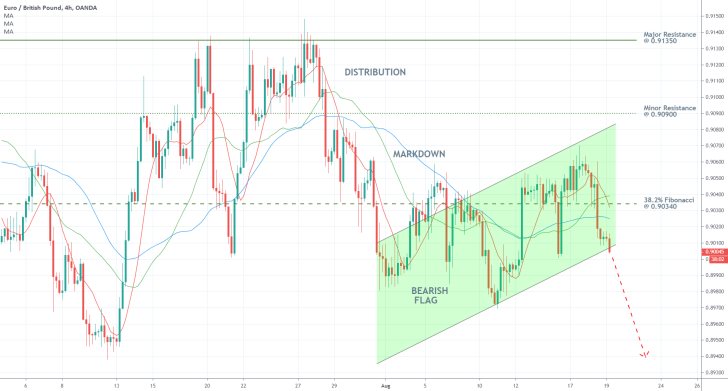
All of these developments could strengthen the pound, which already finds itself in a solid bullish market. As can be seen on the 4H chart below, the EURGBP pair is currently in the process of testing the strength of the Bearish Flag pattern's lower boundary.
The pair has been threading around the 38.2 per cent Fibonacci retracement level at 0.90340 since our previous analysis of the pair, but now it finally looks ready to test breaking further down south.
This assertion is supported by the fact that the 10-day MA (in red) has already crossed below the 30-day MA (in green), which is exhibitive of rising bearish pressure in the short-term.
Once these two moving averages manage to cross below the 50-day MA (in blue), while the price action remains concentrated below the three, this relationship would represent an even more significant piece of evidence demonstrating rising selling pressure.

Trendsharks Premium
Gold is undergoing a correction, as investors take profits to offset losses from falling stock prices, impacting their margins. However, we anticipate a renewed wave of [...]
The Swiss stock market index is mirroring its global counterparts, such as Germany 40 and US100, experiencing a sharp decline following the announcement of new [...]
We’re analyzing the weekly chart to grasp the broader market trend. Over the past three years, the US30 index has surged by 17,000 points, often resembling a nearly straight [...]
Over the past week, the DAX has experienced a sharp decline, plunging by an astonishing 3,400 points. This downward movement is not isolated, as its international counterparts, such as the UK100 and US100, are also facing significant [...]
EURUSD recently formed a double top at 1.0930, signaling a potential trend reversal, and has since begun a correction. After a 600-pip rally since early March, a pullback at this stage is both expected and healthy. Given these conditions, we are placing a [...]
Since early March, EURJPY has surged nearly 1,000 pips, providing us with several excellent trading opportunities. However, as the rally matures, many early buyers are beginning to take profits, leading to a noticeable slowdown in the uptrend. On Friday, the pair formed a [...]
The AUDJPY currency pair continues to be dominated by bullish momentum, as multiple golden cross patterns reaffirm the strength of the ongoing uptrend. Despite this, we are witnessing a much-needed [...]
The EURAUD currency pair appears to be undergoing a trend reversal, signaling a potential shift in market direction. A notable technical development is the formation of a Death Cross on the chart, a widely recognized bearish indicator that typically suggests a [...]
After securing an impressive 200-pip profit last week, the EURJPY currency pair is now undergoing a southward correction, retracing some of its recent gains. Despite this temporary pullback, the Golden Cross remains intact, reinforcing our view that the overall trend continues to be [...]
The appearance of a Golden Cross in Silver strengthens our analysis that the metal is currently in a strong uptrend, indicating further bullish momentum in the market. This technical pattern, where the short-term moving average crosses above the [...]
This trade presents a considerable level of risk and can be classified as an opportunistic move based on recent price action. The GBPUSD currency pair has experienced a substantial bullish rally, surging by nearly 500 pips in a strong upward movement. However, after this extended period of appreciation, the pair is showing signs of a potential [...]
The anticipated Death Cross on the SMI20 appears to be failing as price finds strong support at the 23% Fibonacci retracement level. After testing this area, the index has shown bullish strength, printing several large green candles, signaling an increase in [...]
A Golden Cross has just appeared on the USDJPY chart, signaling a potential bullish move. This technical pattern occurs when the 20 period moving average crosses above the 60 period moving average, a widely recognized indication of increasing [...]
After 2 months of a down trend, we finally see some indications of price recovery for Oil. The golden cross, a historic buy signal, supports this [...]
For the past month, the German DAX40 has experienced a remarkable 10% surge, reflecting strong bullish momentum. Despite ongoing market volatility and frequent pullbacks, every dip continues to attract fresh buyers, reinforcing the [...]
Oil continues its downward trajectory, despite occasional pullbacks. The overall trend remains bearish, reinforced by multiple Death Cross patterns, a classic sell signal indicating further weakness. Adding to this bearish outlook, the critical [...]
Over the past few days, gold has experienced a sharp decline of more than $100. This downturn can be attributed in part to traders securing profits to manage their margins, which are under strain due to the significant drop in major indices. Currently, gold has fallen below the [...]
The NASDAQ 100 index is showing strong bullish momentum, as evidenced by the formation of a Golden Cross on the chart. This classic buy signal occurs when the short moving average crosses above the long term moving average, suggesting that upward momentum is [...]
The EURAUD currency pair has encountered a significant resistance level, failing to break above the critical 61% Fibonacci retracement level. This suggests that bullish momentum is weakening, reinforcing the case for a potential downward move. Given this technical setup, we favor entering a [...]
The UK100 is experiencing a remarkable rally! Over the past few weeks, the British stock market index has surged nearly 800 points. Each minor dip has attracted more buyers, fueling the bullish momentum. However, since last week, we’ve observed a slight [...]


