Ascending and descending wedges are among the most commonly used patterns in technical analysis, making them one of the essential tools in every trader's arsenal. They are typically used as indications of probable trend reversals depending on where they are found, which is what makes them such indispensable markers of likely changes in the underlying sentiment.
Wedges can also be found within an existing trend, in which case they are more likely to signify the probable continuation of the trend. That is why traders need to be familiar with the possible setups under which Wedge structures can emerge so that they can trade on them in accordance with the underlying market bias that they entail. This article shows how to do just that.
Wedges Signifying an Upcoming Trend Reversal:
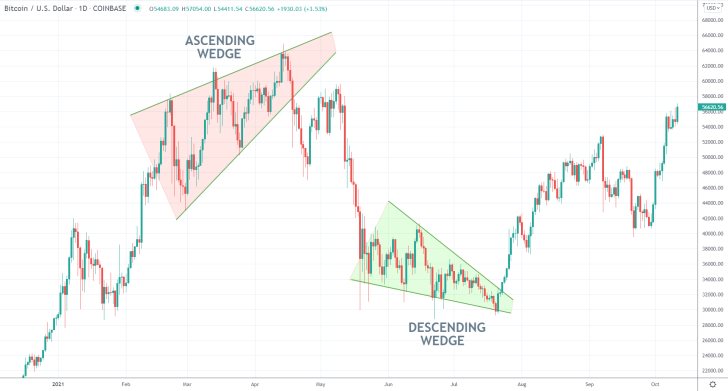
Depending on the market's direction at the time of examination, the observance of a Wedge could indicate a possible trend reversal only if the pattern itself is pointed in the right direction. Notice the two distinct Wedges on the daily Bitcoin chart below:

The first structure represents an Ascending Wedge at the peak of an existing uptrend. The second one is a Descending Wedge at the dip of the subsequent downtrend. Both point in the market's general direction at the time of their developments, which is what traders can perceive as a potential indication of a reversal in the making.
If a Descending Wedge occurs within an existing uptrend or an Ascending Wedge within a current downtrend, bears and bulls should not rush to place their contrarian trades.
In the first case, the Ascending Wedge highlights a bottleneck in the making - the lower boundary of the pattern has a steeper angle than its upper limit. What this means is that while the price action continues to develop higher lows, which is to be expected within an uptrend, the corresponding peaks are becoming lesser and lesser. The Ascending Wedge thus underpins waning bullish commitment in the market, which is a necessary condition ahead of an upcoming bearish reversal.
Bears can trade the Wedge pattern whenever the price action has probed its lower limit at least two times, preferably three. They can also join the market following the eventual decisive breakdown below it.
In the second case, the bottleneck is pointing in the opposite direction. The price action is generating lower peaks as part of the existing downtrend, though the upper limit of the Descending Wedge has a steeper angle compared to its lower end. Thus, the eventual breakout above the pattern signifies the beginning of a new uptrend.
Wedges Indicating the Continuation of an Existing Trend:
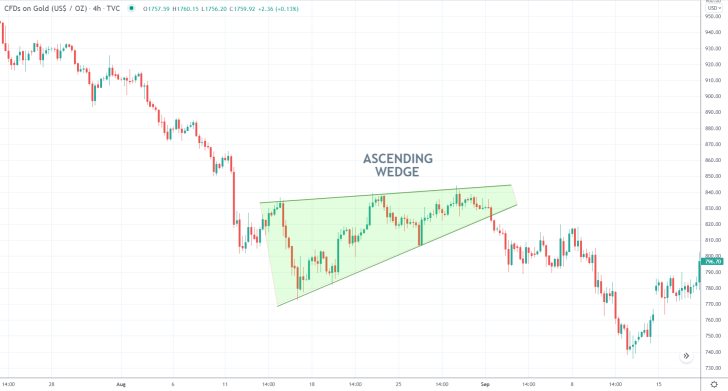
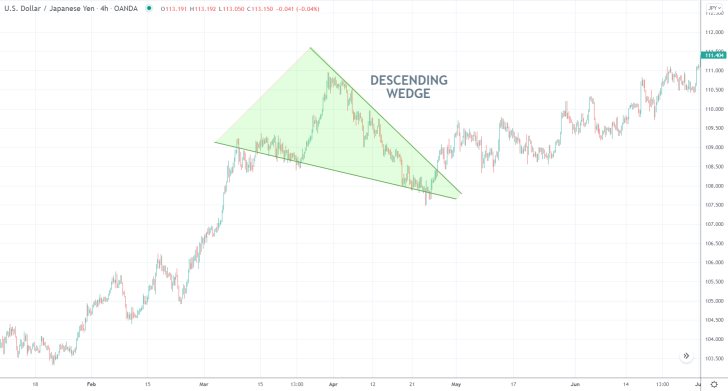
Wedges can also signify the likely continuation of an existing trend when they point to the opposite direction of said trend. Intuitively, Descending Wedges that are found within an uptrend would signal its likely continuation further up north, whereas Ascending Wedges found within a broader downtrend indicate the opposite.

As can be seen on the 4H gold chart above, the steeper angle of the Wedge's lower limit indicates an attempted bullish rebound from what was then the latest dip of an existing downtrend. However, the low-angled upper border of the pattern, underpinned by only marginally rising peaks, signifies the weakness of the bullish commitment at that time.
Intuitively, bears can wait for the correction to be terminated to use trend continuation trading strategies then. They can sell the underlying following the eventual breakdown below the Ascending Wedge's lower limit.

Mirrored logic applies in the case of Descending Wedges occurring within established uptrends. The low-angled lower limit of the pattern coupled with its steeper upper boundary underpins the temporary upsurge in selling pressure, which, nevertheless, is incapable of terminating the underlying trend.
Therefore, bulls can wait for the eventual breakout, such as the one shown on the dollar/yen chart above, in order to execute long orders on the expectations for continued price appreciation.


