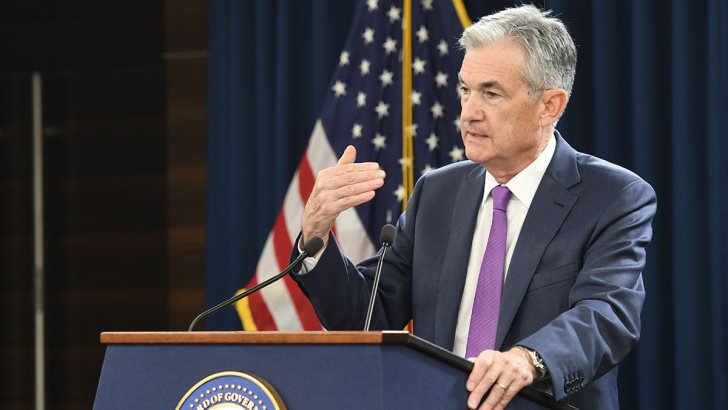
FED Chair Jerome Powell. Image source: Federalreserve, flickr.com
The year looks poised to end similarly to how it had begun, with lots of adverse volatility and surging uncertainty. The latest coronavirus variant has spurred a fresh selloff of higher-risk assets as investors weigh in on the potential impact that a new pandemic wave could have on the still tentative global recovery.
And while all of this seems to entail a very probable increase in market unpredictability by the end of 2021, it is once again time to look beyond the present tribulations and examine the likely direction for some of the most popular assets in 2022.
Headline Inflation, the Most Significant Determinant
For higher-yield assets and lower-risk securities alike, the future course of U.S. inflation would be the most significant determinant for their market directions in 2022. Consumer prices topped a thirty-year high in November (6.2 per cent), representing the most significant threat to recovery.
While members of the Federal Open Market Committee (FOMC) have stated on multiple occasions that they expect headline inflation to shoot above 2.0 per cent in the third and fourth quarters of 2021 before it slowly converges towards the FED's long term goal, the current CPI reading seems to be exceeding their initial projections. That is why many market participants weigh in on the possibility of FED tapering earlier than initially expected.

U.S. MoM Inflation Rate. Image source: TradingEconomics.com
The recently nominated for a second term FED Chair Jerome Powell is due to testify before Congress this week, and his comments will shed more light on FED's next likely course of action. In light of the surging consumer prices, he is likely to adopt a slightly more hawkish-sounding rhetoric, which, in turn, would probably bolster the demand for securities.
At any rate, the Federal Reserve is expected to start to gradually lift the Federal Funds rate in 2022, entailing the end of the 'happy times' on the stock market. This would affect the price of gold and Bitcoin in two starkly different ways:
Expect the Price of Gold to Consolidate in a Range Next Year
Despite the uptick in demand for safe havens due to soaring inflation, this is nowhere near the levels that were observed in the wake of the pandemic. This has allowed the price of the commodity to consolidate around the psychologically significant threshold at 1800.00. As can be seen on the weekly chart below, there is a very significant likelihood that the price action continues establishing a major consolidation range around it in 2022.

Gold 1W Price Chart. Image source: Trendsharks ©, created with TradingView.com
The range spans between the 23.6 per cent Fibonacci retracement level at 1834.31 and the 38.2 per cent Fibonacci at 1684.03. This range was first developed in early 2021, as demonstrated by the ADX indicator, which has been threading below the 25-point benchmark since December 2020.
Notice that the price action has been concentrated just above the 100-day MA (in blue) since mid-2021. Due to its role as a significant floating support, the 100-day MA underpins a major threshold within the range - at 1785.00. The 50-day MA (in green) is about to converge with it, making it an even more prominent support.
That is why a potential breakdown below 1785.00 in early 2022 is likely to be followed by a dropdown to the range's lower limit at 1684.03. This assertion is substantiated by the fact that the Stochastic RSI indicator has entered into its overbought extreme recently, elucidating a probable uptick in selling pressure in the near future.
For as long as the price action remains concentrated within the consolidation range, traders can continue monitoring the Stochastic RSI in order to pick tops and bottoms.
Bitcoin at a Major Turning Point
Bitcoin's direction in 2022 will depend on the behaviour of its price action around a crucially significant threshold nearby.

BTCUSD 1D Price Chart. Image source: Trendsharks ©, created with TradingView.com
The price action has been depreciating as of late, as can be seen on the daily chart above, owing to the aforementioned coronavirus scare in the market. It dropped to the 23.6 per cent Fibonacci at 53485.1, which converges with the 100-day MA (in blue). This level serves as a major make-it-or-break-it threshold.
A rebound from it could signify the continuation of the underlying rally. In contrast, a decisive breakdown below it would likely be followed by a subsequent dropdown to the 38.2 per cent Fibonacci at 43890.9. There are diverging indications that both bulls and bears need to pay attention to.
On the one hand, the MACD indicator has been underpinning mounting bearish momentum since the 23rd of October, which seems to support the expectations of a breakdown. On the other, the latest dropdown appears to be taking the form of a Falling Wedge. This type of pattern typically signifies a likely trend continuation, which was the case the last time such a pattern emerged around the 100-day MA.
That is why a potential breakout above the Wedge's upper limit could then be followed by a test of the previous support-turned-resistance level at 58000.00. A decisive breakout above it would confirm the continuation of the rally further up north.

Gold is undergoing a correction, as investors take profits to offset losses from falling stock prices, impacting their margins. However, we anticipate a renewed wave of [...]

The Swiss stock market index is mirroring its global counterparts, such as Germany 40 and US100, experiencing a sharp decline following the announcement of new [...]

We’re analyzing the weekly chart to grasp the broader market trend. Over the past three years, the US30 index has surged by 17,000 points, often resembling a nearly straight [...]

Over the past week, the DAX has experienced a sharp decline, plunging by an astonishing 3,400 points. This downward movement is not isolated, as its international counterparts, such as the UK100 and US100, are also facing significant [...]

EURUSD recently formed a double top at 1.0930, signaling a potential trend reversal, and has since begun a correction. After a 600-pip rally since early March, a pullback at this stage is both expected and healthy. Given these conditions, we are placing a [...]

Since early March, EURJPY has surged nearly 1,000 pips, providing us with several excellent trading opportunities. However, as the rally matures, many early buyers are beginning to take profits, leading to a noticeable slowdown in the uptrend. On Friday, the pair formed a [...]

The AUDJPY currency pair continues to be dominated by bullish momentum, as multiple golden cross patterns reaffirm the strength of the ongoing uptrend. Despite this, we are witnessing a much-needed [...]

The EURAUD currency pair appears to be undergoing a trend reversal, signaling a potential shift in market direction. A notable technical development is the formation of a Death Cross on the chart, a widely recognized bearish indicator that typically suggests a [...]

After securing an impressive 200-pip profit last week, the EURJPY currency pair is now undergoing a southward correction, retracing some of its recent gains. Despite this temporary pullback, the Golden Cross remains intact, reinforcing our view that the overall trend continues to be [...]

The appearance of a Golden Cross in Silver strengthens our analysis that the metal is currently in a strong uptrend, indicating further bullish momentum in the market. This technical pattern, where the short-term moving average crosses above the [...]

This trade presents a considerable level of risk and can be classified as an opportunistic move based on recent price action. The GBPUSD currency pair has experienced a substantial bullish rally, surging by nearly 500 pips in a strong upward movement. However, after this extended period of appreciation, the pair is showing signs of a potential [...]

The anticipated Death Cross on the SMI20 appears to be failing as price finds strong support at the 23% Fibonacci retracement level. After testing this area, the index has shown bullish strength, printing several large green candles, signaling an increase in [...]

A Golden Cross has just appeared on the USDJPY chart, signaling a potential bullish move. This technical pattern occurs when the 20 period moving average crosses above the 60 period moving average, a widely recognized indication of increasing [...]

After 2 months of a down trend, we finally see some indications of price recovery for Oil. The golden cross, a historic buy signal, supports this [...]

For the past month, the German DAX40 has experienced a remarkable 10% surge, reflecting strong bullish momentum. Despite ongoing market volatility and frequent pullbacks, every dip continues to attract fresh buyers, reinforcing the [...]

Oil continues its downward trajectory, despite occasional pullbacks. The overall trend remains bearish, reinforced by multiple Death Cross patterns, a classic sell signal indicating further weakness. Adding to this bearish outlook, the critical [...]

Over the past few days, gold has experienced a sharp decline of more than $100. This downturn can be attributed in part to traders securing profits to manage their margins, which are under strain due to the significant drop in major indices. Currently, gold has fallen below the [...]

The NASDAQ 100 index is showing strong bullish momentum, as evidenced by the formation of a Golden Cross on the chart. This classic buy signal occurs when the short moving average crosses above the long term moving average, suggesting that upward momentum is [...]

The EURAUD currency pair has encountered a significant resistance level, failing to break above the critical 61% Fibonacci retracement level. This suggests that bullish momentum is weakening, reinforcing the case for a potential downward move. Given this technical setup, we favor entering a [...]

The UK100 is experiencing a remarkable rally! Over the past few weeks, the British stock market index has surged nearly 800 points. Each minor dip has attracted more buyers, fueling the bullish momentum. However, since last week, we’ve observed a slight [...]
