Recently it was announced that Warren Buffett has decided to sell nearly 90 per cent of his Goldman Sachs shares amidst rising coronavirus concerns and prevailing uncertainty in the stock market. The sweeping turmoil in the market has drastically changed the top investor's outlook on the intrinsic value of assets after being jolted by these pandemic developments, and he appears to be looking for a new safe-haven harbour to invest into.
Wheat is one such candidate, whose intrinsic value is likely to be not only left unscathed by the pandemic but potentially be even bolstered by it. As it was argued in the previous analysis on the commodity, the price of wheat is likely to surge in the foreseeable future on investors' concerns over potential disruptions to global supply.
Since that previous analysis was released, the price of the commodity has been consolidating in a range just above the tremendously important psychological level at 100.00. Оn the surface level, there is a global oversupply, which is a by-product of the temporary distortions in the global supply chains as wheat surplus floods warehouses. The world is "drowning" in wheat not because there is more production, however, but because states have overstocked with food in the wake of the crisis.
This, in turn, has resulted in the false assumption that there is a global glut of wheat, whereas in reality aggregate production has not increased during this period. Contrarily, it is likely for net production to have actually diminished due to the governmental lockdowns in the world's biggest producers – the US, Russia, India, China and others. If this were the case, then the net supply and demand pressures in the market would find a new equilibrium in the forthcoming weeks, which would be characterised by increased demand and eroded net supply, thereby crystallising the anticipated surge in wheat's price.
That is why the purpose of today's analysis is to examine the behaviour of wheat's price action and to delineate on the most crucial steppingstones that the commodity would have to overcome as the underlying market pressures start to change.
1. Long Term Outlook:
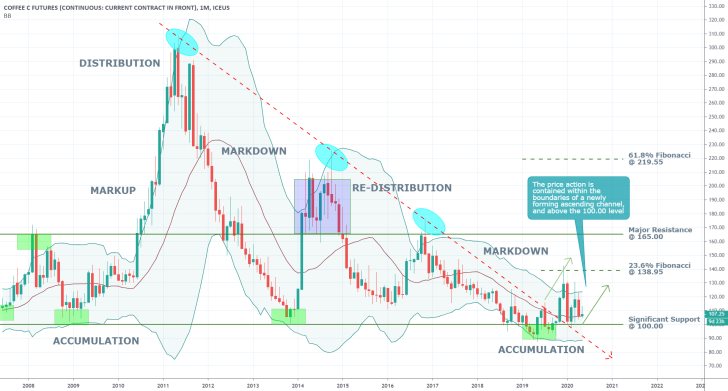
As can be seen on the monthly chart below, the price action has managed to break out above the significant downwards-sloping trend line (in red), which is the most substantial indication of increasing bullish sentiment in the market.

Even though future corrections to the significant support level at 100.00 are still possible, the price action is currently consolidating above the Bollinger Bands' middle line, which is demonstrative of strong support. Therefore, despite the possibility for such interim fluctuations, the price action is highly unlikely to break down below the aforementioned support level with psychological importance.
The Bands themselves have already levelled off horizontally, which is yet another indication of the diminishing selling pressure that prompted the establishment of the previous bearish market. This behaviour favours the development of a new bullish market after the current intermediate range-trading environment is terminated.
The first major obstacle for this new uptrend is going to be the 23.6 per cent Fibonacci retracement level at 138.95. The price action has already failed to break out above it recently, which is elucidating the strength of the level as a prominent resistance. When the price of wheat manages to break out above it eventually, the next primary target is going to be the major resistance level at 165.00.
2. Short Term Outlook:
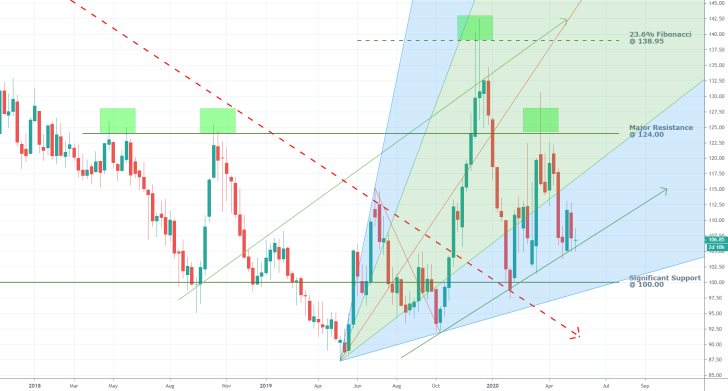
The weekly chart below demonstrates the significance of the 134.00 resistance level, which has managed to hold back the price action on three separate occasions with only one temporary breakout in between.

The price action is characterised by the existence of distinctive waves – impulses followed by retracements, and not a lot of sporadic fluctuation between them. That is why the application of a pitchfan tool can project the magnitude and direction of future waves.
The price action currently finds itself locked in the lowest fragment of the pitchfan, which underlines the still considerable selling pressure in the short term. Nevertheless, the pitchfan's lowest boundary coincides with the significant support level at 100.00, which is yet another confirmation of the previous assertion. Chiefly, that the price action is highly unlikely to break down below the 100.00 threshold.
Meanwhile, a break out back into the pitchfan's middle segment would likely have to coincide with a break out above the major resistance level at 134.00, which would require significant bullish commitment. On the other hand, should the price action succeed in doing both, this would be a considerable confirmation of the newly forming uptrend's strength.
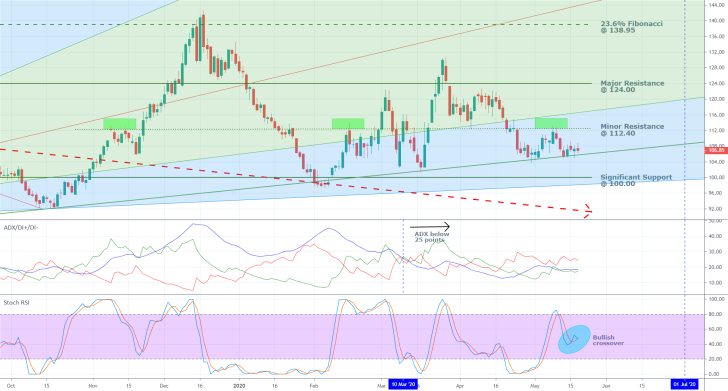
As can be seen on the daily chart below, the pitchfan's lower boundary is likely to level off with the significant support level at 100.00 before the end of June. This provides a crude estimation of when the anticipated bullish trend is likely to start picking up steam. This means that there is little over a month, during which time the aforementioned interim fluctuations to or even temporarily below the 100.00 mark could occur.
The ADX has been threading below 25 points since the 10th of March, which means that wheat's price is technically range-trading at present. Nevertheless, the index is once again getting quite close to this important benchmark. A potential breakout above the minor resistance level at 112.40 could propel the market into a trending environment, which, in turn, could also underline the very first stages of the new bullish trend's development. This level could, therefore, be used by some less risk-averse traders as a potential entry point.
The Stochastic RSI manifests the rising buying pressure in the short term.

3. Concluding Remarks:
Overall, almost all underlying indications are congruent with the broader expectation for the development of a new major bullish trend. Some uncertainties, however, still remain. Chiefly, when exactly is the market going to definitively transition from its current range-trading state to the anticipated trending environment. Moreover, it remains to be seen whether this process is going to be accompanied by the emergence of adverse and interim downswings to or below the significant support level at 100.00.
It should also be stressed that this new bullish trend is likely going to take years to develop fully, akin to the preceding bearish markdown. Therefore, traders should adjust their strategies and expectations accordingly.
Disclaimer: Your capital is at risk! Trading and investing on the financial markets carries a significant risk of loss. Each material, shown on this website, is provided for educational purposes only. A perfect, 100% accurate method of analysis does not exist. If you make a decision to trade or invest, based on the information from this website, you will be doing it at your own risk. Under no circumstances is Trendsharks responsible for any capital losses or damages you might suffer, while using the company’s products and services. For more information read our Terms & Conditions and Risk Disclaimer.


