The price action of Bitcoin, similarly to other prominent assets, has been consolidating around the Holidays owing to diminished trading activity. The cryptocurrency fell from the November peak and is currently threading just below the psychologically significant threshold at $50000.00.
The majority of cryptocurrency enthusiasts expect the crypto flagship to resume appreciating shorty as trading activity picks up once more, but that does not mean that the correction is necessarily over. That is why they should refrain from premature entries.
The price action is likely to continue flirting with the closest support level, possibly registering additional adverse fluctuations, which is why imprecise entries are likely to suffer. However, the underlying setup is also suitable for the implementation of trend continuation trading strategies by bulls looking to join Bitcoin's broader rally at a discounted level.
What is the Broader Outlook?
The descending channel, as illustrated on the daily chart below, represents the current correction from Bitcoin's historic rally. The first notable thing worth careful consideration is the recent reversal from the channel's middle line (black dotted line). This elucidates the prevalence of bearish bias at present.
On the other hand, the price action continues to strengthen above the 61.8 per cent Fibonacci retracement level at 4445291, which represents the upper limit of a massive support area (in green). This is where bulls would be expecting to see yet another rebound and the continuation of the existing rally. Both factors considered, the price action is likely to continue consolidating in a range between the middle line of the channel and the 61.8 per cent Fibonacci over the next several weeks.
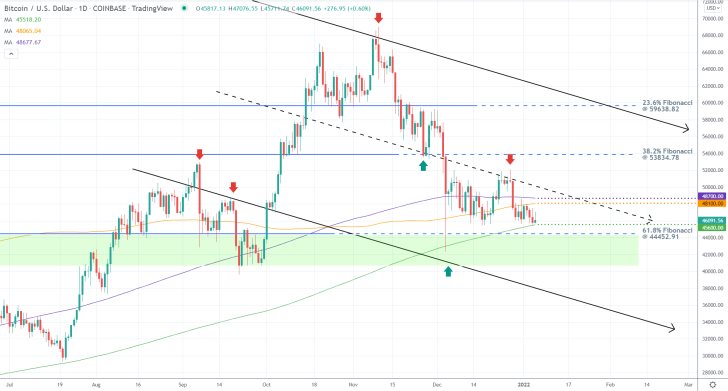
Pay attention to the three moving averages. The 400-day MA (in green) recently crossed above the 61.8 per cent Fibonacci, making it an even more prominent support level. The price action is also concentrated above the major support at 45600.00, underpinned by the 400-day MA, which is the closest potential turning point for the bearish correction; this being merely the third test of the MA since July of last year.
On the other hand, the price action has already broken down below the two thresholds at 48700.00 and 48100.00; the former being highlighted by the 300-day MA (in purple) and the latter by the 200-day MA (in orange). The two supports-turned-resistance make it less likely for a decisive breakout above the middle line of the channel to occur any time soon.
The Currently Developing Wedge Near the Likely Dip of the Correction
As can be seen on the 4H chart below, the latest downswing, which emerged following the reversal from the middle line of the channel, is currently taking the form of a Falling Wedge. This is a type of pattern that, whenever found near the bottom of a recent correction or a downtrend, entails a probable bullish rebound currently in the making.
Given that this Falling Wedge is occurring near the aforementioned support at 45600.00, a bullish rebound from the 400-day MA is now looking even likelier. However, bulls should be cautious of potential false breakdowns below 45600.00 before this could take place.
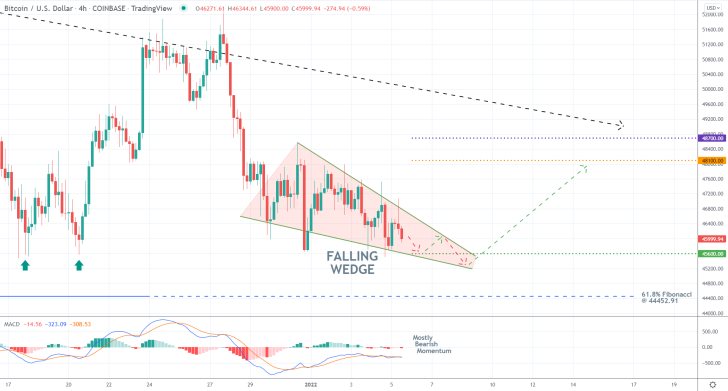
Even though the 12-day EMA (blue) is threading above the 26-day EMA (orange), both of which comprise the MACD, the underlying momentum remains prevailingly bearish, which is underscored by the subdued histogram of the indicator. This represents yet another reason why bulls should not rush to enter long prematurely.
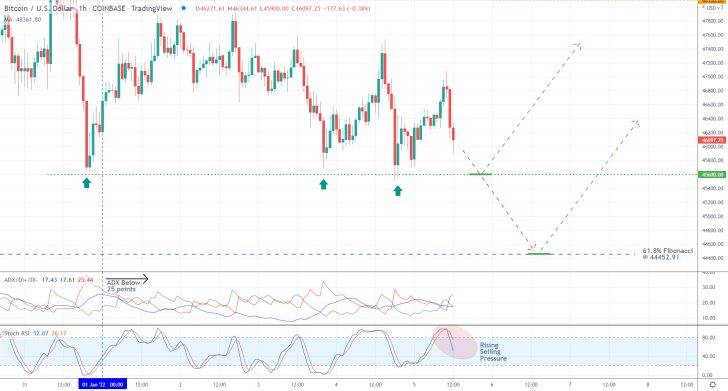
Pay attention to the behaviour of the price action in the very short term, as demonstrated on the hourly chart below. The ADX indicator has been threading below the 25-point benchmark since the 1st of January, underpinning the range-trading conditions that have persisted since then. Meanwhile, the Stochastic RSI indicator is signalling mounting selling pressure.
Both of these signals seem to corroborate the expectations for the extension of the correction a little bit lower before a decisive bullish rebound could occur.
Concluding Remarks
Market bulls can take advantage of this opportunity in one of two ways, depending on their levels of risk-aversion. They can place long limit orders either at the aforementioned support level at 45600.00 or the 61.8 per cent Fibonacci at 44452.91.
In either case, their supporting stop-loss orders should not be placed deeper than $250 below their initial entry levels. That is so because, as stated earlier, the price action continues to consolidate within a massive bottleneck, which presupposes potential adverse fluctuations over the next several weeks. It is better to attempt several entries incurring marginal losses, as opposed to incurring a substantial loss from a single position with a very deep stop-loss.
Bulls' next target would be the middle line of the descending channel. Due to its close proximity to the 300-day and 200-day MAs, bulls could substitute their fixed stop orders for floating TPs once the price action draws near to 48100.00. That way they would be able to benefit from a potential breakout further up north, while simultaneously protecting themselves against equally as probable reversals from the middle line of the channel.
Is Bitcoin's Correction Coming to an End?
So far, the new year has not been especially good for Bitcoin, as the cryptocurrency fell to the psychologically significant threshold at 40000.00. The subsequent pullback gave traders and investors a glimmer of hope for a potential break in the downtrend, but does this mean that the most popular cryptocurrency is once again ready to resume climbing higher?
The selling pressure was bolstered recently because of the political crisis in Kazakhstan, which is one of the energy hubs for crypto mining. The political tensions in the former soviet state underscored the fragile system of the cryptocurrency market. However, the initial shock is gradually subsiding, which is what may give a respite for the jolted market.
Though the underlying fundamentals have not changed drastically over the last couple of weeks, the latest inflation data in the U.S. is likely to have a negative impact on the greenback in the short term. This, in turn, would likely benefit higher-risk assets, such as Bitcoin.
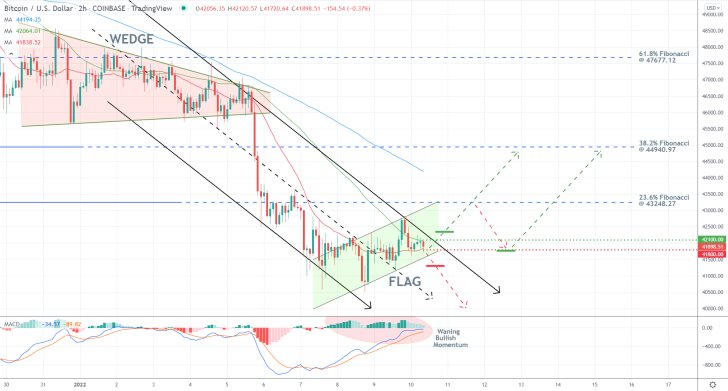
As can be seen on the 2H chart above, the price action remains concentrated within the boundaries of a descending channel. The beginning of the latest downtrend was signified by the completion of a major wedge pattern. Meanwhile, the currently emerging Flag represents a temporary break within the downtrend.
What is especially interesting about this Flag is that it emerged from the psychologically significant support at 40000.00, which in itself could represent a major barrier to future breakdowns. Nevertheless, this does not necessarily signify the beginning of a new uptrend on its own.
On the one hand, the price action is currently consolidating above the major support level at 41800.00, underpinned by the 20-day MA (in red); this signifies mounting bullish commitment in the very short term. On the other hand, the price action remains concentrated below the upper limit of the descending channel and the major resistance level at 42100.00, underscored by the 50-day MA (in green). Given the waning histogram of the MACD, this implies the likely completion of the current pullback.
Bulls and bears would be able to trade the underlying set-up depending on the price action's subsequent behaviour. The former would be able to execute long market orders around 42400.00, if the price action manages to penetrate above the down channel decisively. Bulls would also be able to go long at the 42100.00 resistance-turned-support at the end of the next pullback.
Bears, in contrast, would be able to enter short around 41300.00, provided that the Flag is completed within the descending channel and the price action reverses from its upper limit. The stop-losses of both should not exceed $150 from their respective entry levels.
The first target for bears would be the psychological support at 40000.00, while bulls would be waiting for a pullback to the 23.6 per cent Fibonacci retracement level at 43248.27.
Bitcoin Set to Break Below $40k
The price of crude oil has recently established a sizable bullish pullback, which now appears complete. Given that the price action seemingly cannot break any higher, the broader downtrend seems ready to continue probing lower. The next major target would be the psychologically significant support level at 40000.00.
Bitcoin had a chance to recover amidst the growing struggles of the dollar; however, it did not take advantage of the greenback's woes triggered by soaring inflation. This seems to be substantiating the expectations for another major correction on the higher-yield asset.
Other higher-risk assets are not fearing any better, either. The Nasdaq composite reversed from a major resistance level, exactly as was forecasted by our latest analysis of the index. Therefore, all indicators seem to suggest the very probable extension of Bitcoin's downtrend lower. The underlying setup is thus suitable for the implementation of trend continuation trading strategies.
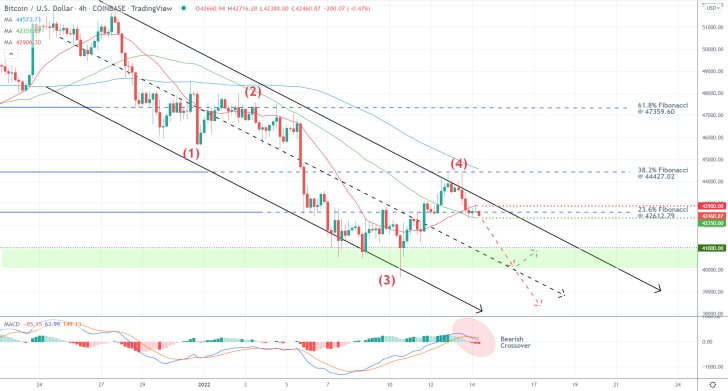
As can be seen on the 4H chart above, the price action remains concentrated within the limits of a major descending channel. The aforementioned pullback reversed from the channel's upper border, representing the first bearish indication. Moreover, the price action then broke down below the 23.6 per cent Fibonacci retracement level at 42612.79.
As it did so, the 12-day EMA crossed below the 26-day EMA, as demonstrated by the MACD, underpinning the latest uptick in bearish momentum. The declining histogram of the indicator further substantiates this.
The pullback actually serves as the second retracement leg (3-4) of a broader 1-5 impulse wave pattern, as postulated by the Elliott Wave Theory. It follows that the third and final impulse leg (4-5) would probably penetrate below the dip of the second impulse leg (2-3), which gives credence to the expectations for a breakdown below the psychologically significant support level at 40000.00.
Bears can therefore look for an opportunity to sell around the current spot price, placing their stop-loss orders just above the 42900.00 level, underscored by the 20-day MA (in red). They can implement floating TPs right from the get-go.
A decisive breakdown below the 50-day MA (in green), which is currently positioned at 42350.00, would confirm the rising bearish sentiment.
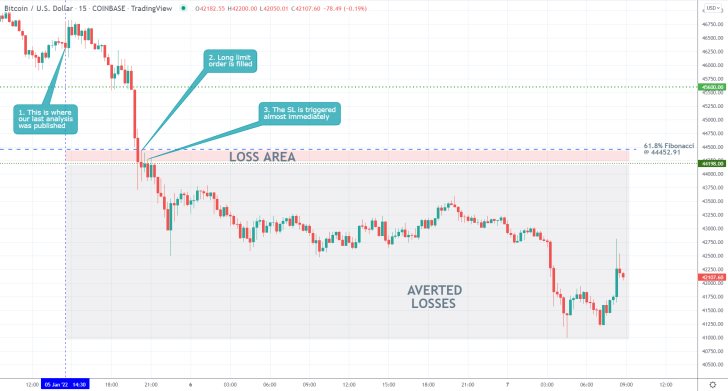
- The expectations of our last Bitcoin analysis for a rebound from the 61.8 per cent Fibonacci retracement level at 44452.91 were not realised.
- The price action broke lower because of the currently brewing situation in Kazakhstan, as local protests threaten energy production. The fallout is so far being very damaging to the cryptocurrency market as it undermines crypto mining.
- The strongest aspect of the analysis was the narrow stop-loss, which prevented much bigger losses. This is why tight risk management is so essential for mitigating the risk of such unforeseeable events.
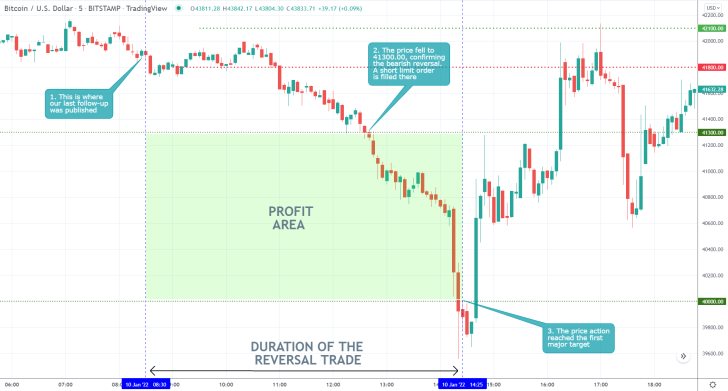
- Our last Bitcoin follow-up proved to be a massive success. Shortly after its release, the price action broke down below the major support level at 41800.00, thereby confirming the reversal from the channel's upper limit.
- Then, it penetrated below the major support at 41300.00, filling a short limit order.
- The subsequent dropdown eventually reached the psychologically significant support level at 40000.00, which was the first major target for the trade. It garnered more than 3.0 per cent in profits.
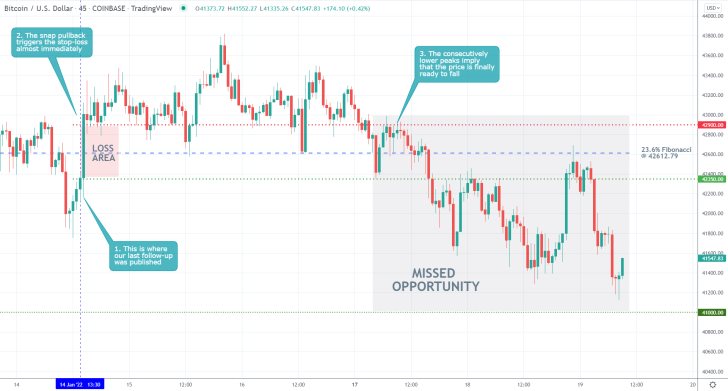
- Shortly after the release of our last Bitcoin analysis, the price action rebounded promptly. This terminated the selling opportunity and hit the stop-loss just above the 42900.00 resistance level shortly afterwards.
- This is a good example of why one needs to implement narrow stop-losses when trading on the expectations for a reversal from a major Fibonacci threshold.
- The subsequently observed consecutive lower lows could have been perceived as an indication of a potential new selling opportunity.
Disclaimer: Your capital is at risk! Trading and investing on the financial markets carries a significant risk of loss. Each material, shown on this website, is provided for educational purposes only. A perfect, 100% accurate method of analysis does not exist. If you make a decision to trade or invest, based on the information from this website, you will be doing it at your own risk. Under no circumstances is Trendsharks responsible for any capital losses or damages you might suffer, while using the company’s products and services. For more information read our Terms & Conditions and Risk Disclaimer.


