Undoubtedly one of the most crucial events taking place this week is the highly anticipated release of Apple's quarterly earnings report. The fact that it is going to be the first such release for the year coincides with an already volatile and speeding-up market, all of which amounts to very exciting trading opportunities. Many traders and investors are already positioning themselves on the market, expecting the aftermath of the report's release to cause colossal price swings in Apple’s share price. That is why this analysis aims to examine all of the important underlying aspects of Tuesday's release so that the reader can make an informed decision as to how to position himself or herself and trade with the company's share price post-release, depending on the way in which the situation develops afterwards.
1. The Likely Impact of EPS and Revenue Data on the Price Action:
Apple Inc. is scheduled to report quarterly earnings data for the period ending 31st of December 2019, which is technically the first quarter (Q1) of 2020. According to the consensus forecasts, the Silicone valley giant is anticipated to deliver record-breaking earnings per share (EPS) of $4.53. Such results would potentially surpass the previous record at $4.18, which was delivered exactly one year ago. Thus, the same time of release predisposes the market conditions for another impactful release.
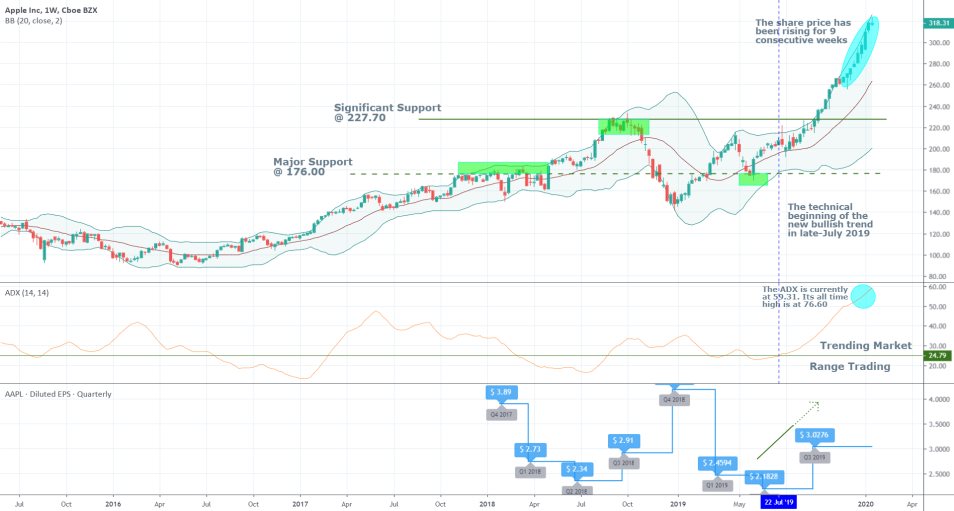
Back then, the positive surprise was just 1 cent ($4.18 reported vs $ 4.17 expected). Nevertheless, the share price jumped by 6.83 per cent following the release, and thus the preceding bearish trend was terminated, and a new bullish one was established. This time, however, the situation is slightly different. The price is already moving in a major bullish trend, which means that another solid performance by Apple is not going to result in the formation of a new trend, but rather it would bolster the already existing one. Thus, trend continuation patterns on the price chart would be preferable for execution to trend reversal ones. It should also be noted that if the EPS data disappoints, depending on the scope of the market surprise, it could prompt a new bearish short-term correction or even possibly a new bearish trend. Consider the current situation as exemplified by the following chart:

Firstly, the almost unprecedented longevity of the current bullish trend should be acknowledged. The price has increased in 21 weekly trading sessions, whereas marginal bearish corrections have occurred on only three weeks. By the weight of this evidence alone, it could be argued that the current bullish trend shows no signs of slowing down at all, and it would likely persist in the foreseeable future.
Secondly, the significance of the trend is further confirmed by the expanding Bollinger Bands, which is also an indication of increasing volatility, as well as by the Average Directional Index (ADX). Apple’s share price has followed closely the upper-band of the former indicator, which manifests the endurance of the bullish trend. Likewise, the latter indicator is currently at 59.31 points, which confirms the trending environment. In comparison, the most significant level that the ADX for Apple’s share price has ever reached is 76.60. This means that there is still spare capacity for the current bullish trend to continue rising. Typically, the underlying market environment is said to be trending when the ADX is above 25 points.
Thirdly, there are ample reasons to expect the EPS data to continue on its current course of gradual improvement, as demonstrated by the Diluted EPS indicator. The pick-up, which was initiated in Q4 for 2019, is expected to be continued this week, thus supporting the current price hike. Overall, the prevailing expectations are for a very robust earnings report, and the revenue of the powerhouse company is likely to edge higher to $88.1 billion, which is just shy of Apple's record. The company’s current valuation is estimated to be at $1.4 trillion, which puts the company in a very good spot to break old records and establish new ones.
2. Other Key Figures from Tuesday’s Report to Watch Out for:
- iPhone Sales. iPhone sales still comprise the bulk of Apple’s revenue streams (expected to reach 59 per cent last quarter), so the total number of all devices that have been sold during the previous period is going to be of pivotal importance. According to the Financial Times, iPhone sales are expected to reach $51 billion last quarter, which would be up from the recorded $33.3 billion in the previous quarter ($36.7 billion were recorded for the same quarter last year). The sizable boost that is expected on iPhone revenue is owing mostly to the new iPhone 11, which was released in the fall of 2019 exactly before the holidays season.
Some market analysts feared that the newest model in the series would not sell especially well given that it does not introduce anything new to the market apart from a third camera. They based those assertions on the speculation that most consumer would rather wait for the release of the next 5G iPhone, which is due to take place in the latter part of 2020. Nevertheless, Apple changed its price policy for the new iPhone 11 by setting its starting price at $699, which was welcoming change of pace for the consumer market, likely resulting in bolstered demand.
- Services Revenue. Undoubtedly the most sensitive and volatile component of the upcoming earnings report, the observed changes in the services revenue is anticipated to have the most substantial impact on Apple’s share price. That is so because of Tim Cook’s ambition to transform the company’s policy by boosting its future revenue streams from services (e.g. the iTunes Store; the App Store; Apple TV+ and more). Thus, bolstered services sales are going to be a good gauge of the CEO’s current success with his undertaking. If, however, they fail to meet the initial forecasts, the share price is very likely to react negatively to it.
3. The Potential Impact of the Current Geopolitical Landscape on Apple’s Mid-Term Performance:
Apart from the financial data set for release tomorrow, traders are encouraged to consider other crucial developments that might impact the share price in one way or another before they enter the market.
- The Deadly Coronavirus in China. As of today, there are more than 80 reported casualties of the fast-spreading pathogen. As the virus spreads globally, albeit, at a slower pace than it does in China, panic becomes increasingly prevalent in the stock market. Investors fear that the aftermath of the virus could curb the slow stabilisation of the global economy, which might even turn into a new recession if the situation blows out of proportion. Thus, investors are promptly searching for moving their funds to safe-haven securities such as gold, and out of riskier assets, such as the fluid stock market. Consequently, even if Apple's quarterly performance surpasses all initial expectations, there is a risk that the subsequent share price surge might be curbed by this potential removal of liquidity from the stock market. It is, however, still relatively soon to project the likely proportions of such transformational changes, and further monitoring of the situation as it develops is necessary.
Additionally, China is one of the biggest iPhone markets in the world, so the escalation of the pandemic is likely to affect the sales there negatively as the consumer sentiment starts to wane. This is a relatively new development on the market, and therefore it will not be reflected on the company’s earnings performance, however, the growing uncertainty and impeded sales in China could have longer-lasting consequences for Apple's market there, potentially offsetting the likely positive earnings report.
4. What is the Current Market Setup and How Can it be Traded On?
Arguably, the best trading opportunity that is created from the current market environment is the execution of a long position. The expectations for a very robust earnings report in addition to the already strong bullish trend are likely to result in its continuation. There are, however, reasons to believe that certain bearish corrections could form in the very short-term before the price continues rising. Therefore, different kinds of trades can be executed depending on the reader’s particular preferences (risk-aversion in particular).
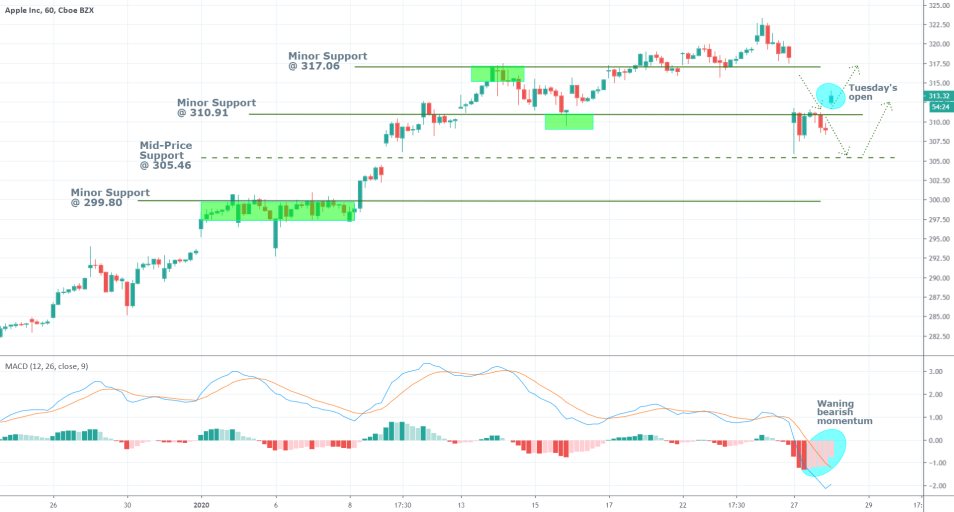
Additionally, some traders might prefer to open their trades later today and position themselves before the release of the data. In contrast, others might feel more secured if they open a trade after the release of the report. (See the difference between proactive and reactive trading). It should be noted that the current market setup looks more or less the same for the two likely approaches. However, many things can transpire leading up to the release of the earnings report, and therefore a reactive trading strategy seems to involve less trading risk. Consider the following hourly price chart:

The MACD is indicating the waning bearish momentum. There are several important price levels to consider, all of which could be treated as potential entry levels. Finally, the volatility is expected to increase drastically after the market opens on Wednesday when the outcome of the report would be reflected on the underlying price action. Therefore, the use of limit orders is preferred to the use of market orders for reactive trading as the former offer better prospects for precise entry, thereby reducing the risks of adverse slippage.
5. Proactive Trading on the Current Market Setup:
The following instructions are better-suited for traders who want to position themselves on the market prior to the release of the earnings report. However, it should be mentioned that thereby the risk would be much higher compared to reactive trading.
Scenario 1 – Entering the Market Price. Ensures execution; however, it may also involve sub-optimal entry
Entry Level – Around Tuesday’s open price at 312.50.
Stop-loss – just below the mid-support level at 305.20
Scenario 2 – Entering Shortly Before Tuesday’s Close. Volatility is anticipated to gradually grow during today's trading session, especially in the 2 hours before the market close. Thus, such an order might not be executed properly if left for the last minute; however, it might offer better prospects for more advantageous entry.
Entry Level – depending on how the market develops next. No trades should be opened if the price goes below the psychologically important 300.00 price level.
Stop-loss – once again depends on the subsequent development of the market prior to today’s close. At any rate, it should not be placed further than 10 dollars away from the entry level.
Disclaimer: Your capital is at risk! Trading and investing on the financial markets carries a significant risk of loss. Each material, shown on this website, is provided for educational purposes only. A perfect, 100% accurate method of analysis does not exist. If you make a decision to trade or invest, based on the information from this website, you will be doing it at your own risk. Under no circumstances is Trendsharks responsible for any capital losses or damages you might suffer, while using the company’s products and services. For more information read our Terms & Conditions and Risk Disclaimer.


