Over the last several days, Italy was struck with over 200 confirmed cases of the deadly coronavirus. At least seven deaths were reported in the media since Tuesday, which sparked rising fears in the country, as the government ramped up its efforts to curb the spread of the virus by quarantining the affected northern parts of the country. Vast portions of the wealthy Lombardy and Veneto regions are currently placed under lockdown after Italy became the most affected country in Europe.
In addition to the threat from the virus itself, investors are now becoming increasingly worried that Italy's economy, which was already treading very close to a recession prior to COVID-19’s outbreak, will contract substantially. The affected regions in northern Italy contribute more than 20 per cent to the GDP of the country. Because most economic activity there is virtually halted, for the time being, that grim reality seems even more likely. In that sense, the outbreak of the deadly virus is perceived as the probable cause that could finally propel the economy into that long-feared prospect of a new recession.
Amidst those rising fears, the most significant stocks index in Italy – the FTSE MIB or Milano Indice di Borsa with a thicker IT40 – has already wiped out nearly 7 per cent of its value in less than three trading days. With most of those 40 bluechip companies’ operations continuing to suffer due to the inhibited economic activity, the index is expected to continue losing steam in the forthcoming days. That is why the main purpose of this analysis is to evaluate the negative impact of the current situation on the index's price and to establish how low the price can go before it finds support.
1. Long-Term Outlook:
Leading up to the flare-up of COVID-19 in Italy, the IT40 was threading at an all-time high near 25796, as can be seen on the weekly chart below. Just last week the price had reached that peak, which also acts as the peak in a classic 1-5 Elliott impulse wave before it plummeted by more than per cent in the wake of the coronavirus's spread. In light of the Elliott Wave Theory (EWT), it can be asserted that the price action was due for a bearish correction, and in that sense, the COVID-19 going viral acted as a trigger for that anticipated pullback.
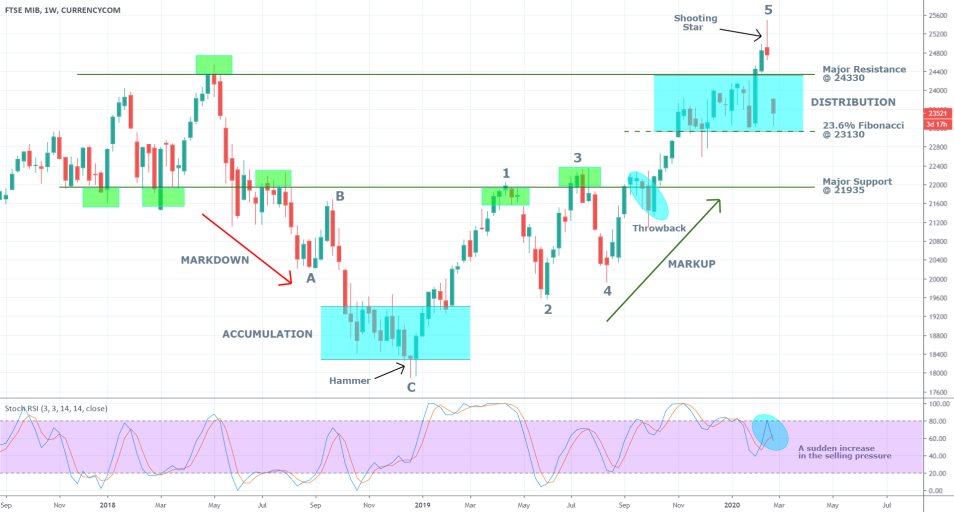
Last week's candlestick is a shooting star, characterised by its small body and large upper tail, which indicates a sudden prevalence of bearish sentiment and a likely termination of the recent bullish trend. This is the second primary indication that at least in the short-term, the bears might prevail and thereby cause a new correction.
Under the rules of the Wyckoff Cycle, it can be argued that the price action is currently establishing a distribution stage, which is typically found towards the end of an existing bullish trend and is a probable precursor of a new bearish downswing. In that sense, last week's shooting star is also what is commonly referred to as a 'spring' in the Wyckoff cycle – a failed attempt to continue establishing the pre-existing trend only to see the price action fall back within the boundaries of the distribution. The distribution itself is contained within the edges of the major resistance level at 24330, which is the channel's upper boundary, and the 23.6 per cent Fibonacci retracement at 23130, which is acting as a support level and the channel's lower boundary. Therefore, if the price manages to break down below that support level, this would provide further confirmation of the downswing's strength and support the formation of a new Markdown (downtrend).
Should a new markdown start to develop, the first target level would be the peak at the second impulse in the Elliott wave pattern (point 3 on the chart) at 22260, and the second target would be the major support level at 21935. The change in the underlying market sentiment is underpinned by the Stochastic RSI (Relative Strength Index), which illustrates a sudden crossover between the stochastic MA and the index itself. Thereby, the Stochastic RSI exemplifies the prompt increase of the overall selling pressure that is currently weighing on the IT40, and is likely to compel other bears to start executing short orders and subsequently drive the underlying price action lower.
2. In the Spotlight: GDP Growth Rate and Retail Sales:
As regards the fundamental aspect of the current situation, two crucial factors deserve close attention. The first one is connected to Italy’s GDP growth rate. The IT40 is likely going to be hit by the government’s revised expectations for growth that is going to be recorded at the end of the current fiscal quarter – Q1 2020. As it was mentioned earlier, most of the economic activity in Italy’s richest regions is currently limited, as the government strives to curb further spread of the virus, which is having a negative indirect impact on the industry.
It is for that reason that the longer the situation remains the same, the more detrimental impact that is going to be exerted on the country’s gross output. Consequently, the likelier it becomes for Italy to enter into a recession, which is why the IT40 is currently falling on speculations that the quarantine in Lombardy and Veneto is going to continue for at least two weeks (COVID-19’s incubation period).
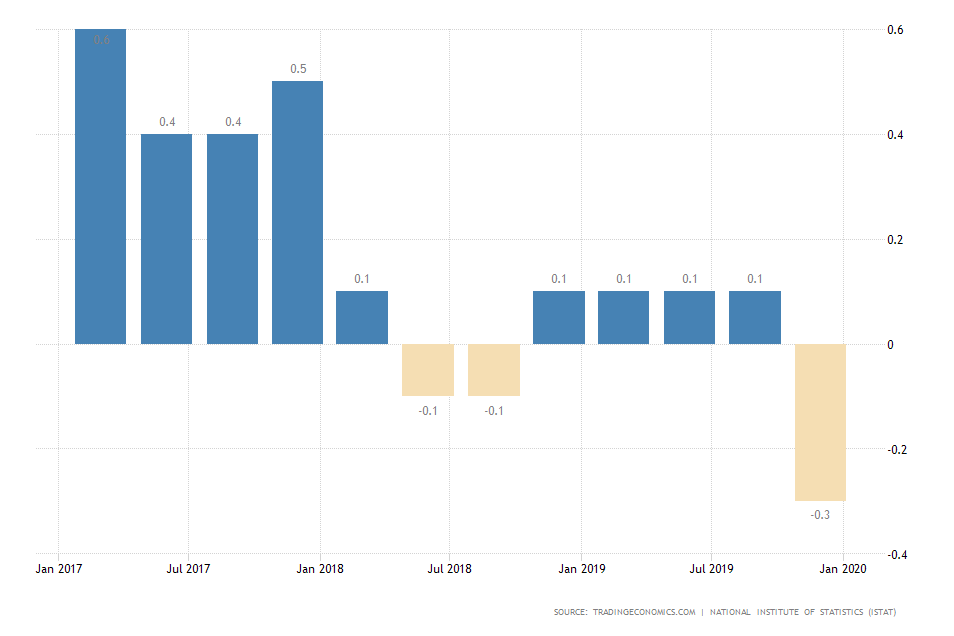
The outbreak of the virus comes at a particularly bad time, seeing as the Italian economy was already quite fragile beforehand. In Q4 of 2019, it recorded a marked tumble in its growth rate by 0.3 per cent, which was the steepest single contraction since 2013. In that sense, the negative impact from the production deadlock, that has just started yesterday, is only going to become more pronounced in the following days and weeks, which is subsequently going to accelerate the rate of economic contraction, lest the epidemic is dealt with swiftly.
That is why the IT40 is likely to continue being strained from the indirect impact of the quarantine as it continues to be in effect, even if no more cases are reported in the following days.
The second factor is the retail sales index. At times when consumers become alarmed from a perceived threat, such as the spread of the coronavirus, they typically flood the local supermarkets and start buying provisions of essential need. A good example of this are the supermarkets in Lombardy, which were sold out yesterday after the region of more than 50 000 people were put under quarantine.
Even though production is generally impeded at times of public distress, the overall demand for such essential goods is typically boosted marginally, which coincidently offsets (partially) the negative impact of the subdued production. Therefore, the perceived freefall of the IT40 may not be as drastic as it may seem at first glance.
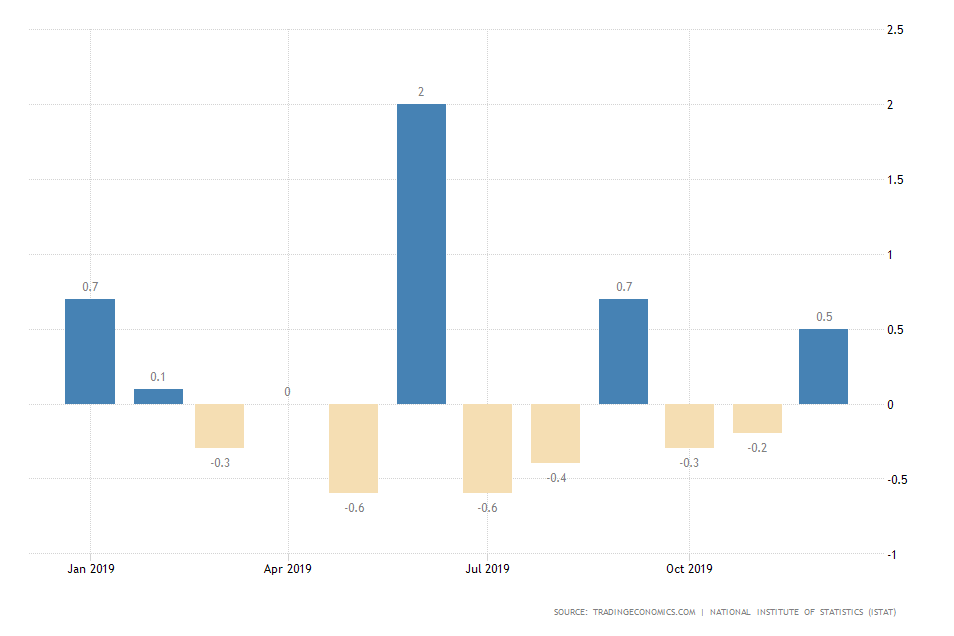
An indication of this effect would be an improvement in Italy's monthly retail sales. Therefore, if the index exceeds the 0.5 per cent that was recorded in January, it would indicate that the aggregate demand in the country has not waned, and instead has increased on the virus fears. In other words, the temporary surge in demand could offset at least partially the temporary decline of production, both developments owing to the outbreak of the coronavirus.
3. Short-Term Outlook:
As can be seen on the daily chart below, the Average Directional Index (ADX) has been threading below 25 index points since early January 2020, which attests to the range-trading environment that is prevalent within the boundaries of the distribution channel. This illustrates the likelihood for the formation of a new markdown, should the price manage to break down below the distribution’s lower boundary – the 23.6 per cent Fibonacci retracement at 23130.
The price action is threading quite close to set level, which means that within the end of today's trading session such an attempted breakdown is very likely to take place. Nevertheless, the likelihood for the formation of false breakdowns should not be entirely ignored, given the existence of the previous one that is clearly visible on the chart.
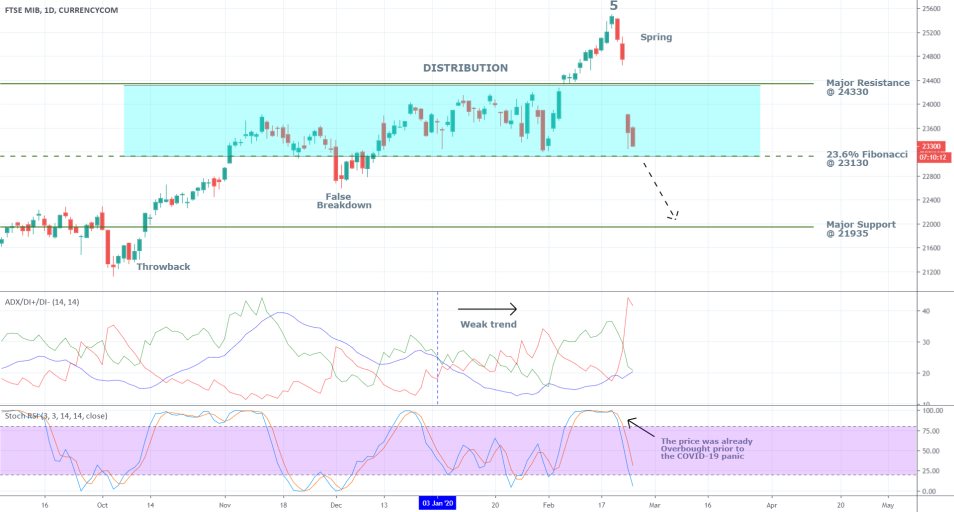
Meanwhile, the projected downswing towards the major support level at 21935 seems more plausible given the behaviour of the stochastic RSI on the daily chart. The RSI was already threading in the ‘Overbought’ extreme prior to the outbreak, which means that the spread of the COVID-19 acted as a catalyst for the bears, who were prompted to start executing short orders. Therefore, the previously-anticipated bearish correction is likely to persist within the next several days to weeks.
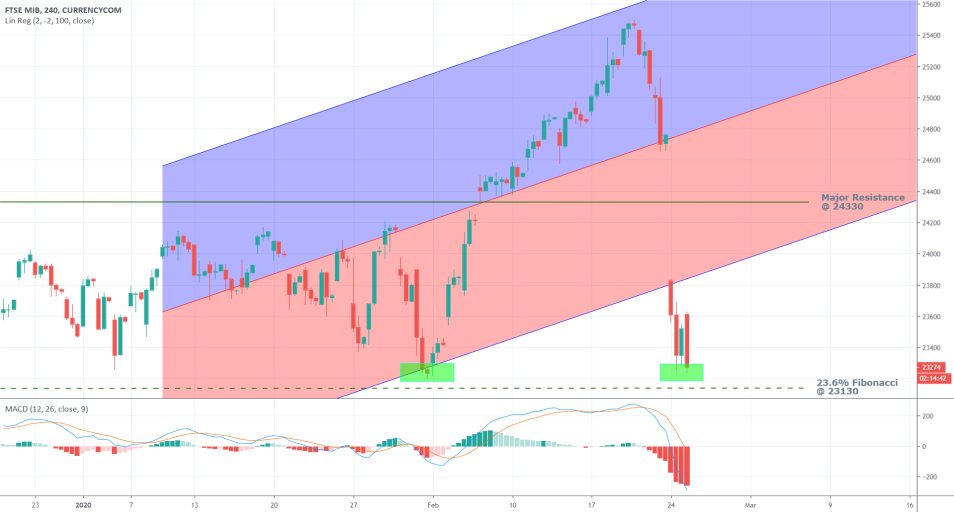
The MACD on the 4H chart above confirms the rising bearish momentum in the short-term, as the price has clearly broken down below the regression channel’s lower boundary. The likelihood for the formation of some pullbacks towards the channel’s lower boundary should not be completely dismissed.
4. Concluding Remarks:
Overall, the price is more than likely to continue trading lower into the week as the situation in Lombardy and Veneto continues to develop. The mounting investors’ pressure in Italy and elsewhere is likely to continue weighing down on global stock markets for at least two weeks. This does not necessarily mean that the selloff would continue at the same tremendous pace as the one that was observed yesterday; however, going against the trend at the current rate would be extremely risky.
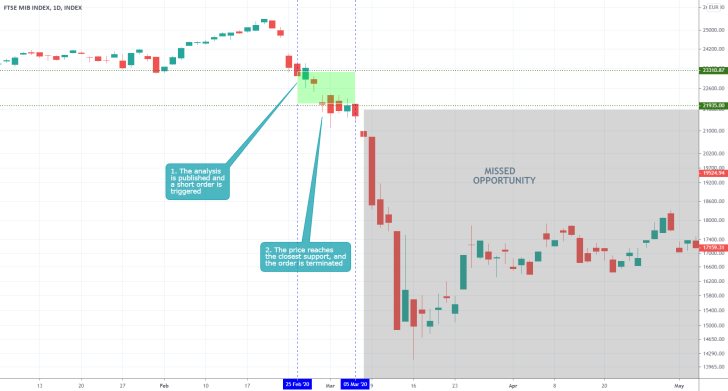
- The situation is quite similar to the second to last entry in the journal regarding the German DAX index, in that the analysis correctly captured the bearish sentiment in the market at that time, but it underestimated the subsequent stock market crash. The same takeaways apply here.
Disclaimer: Your capital is at risk! Trading and investing on the financial markets carries a significant risk of loss. Each material, shown on this website, is provided for educational purposes only. A perfect, 100% accurate method of analysis does not exist. If you make a decision to trade or invest, based on the information from this website, you will be doing it at your own risk. Under no circumstances is Trendsharks responsible for any capital losses or damages you might suffer, while using the company’s products and services. For more information read our Terms & Conditions and Risk Disclaimer.


