The USDCHF is one of those assets whose price action has become decidedly muted over the last several days and weeks, following the coronavirus market crash in early March. Diminished adverse volatility and the general transition of the market within a decisive range-trading environment, are both indications of an asset's stabilisation in the wake of a substantial market turmoil.
All of this means that while USDCHF's price action continues to consolidate within the boundaries of an increasingly narrower range, the underlying market sentiment would become more and more neutral. This behaviour, in turn, is a significant precursor for an eventual massive breakout in either direction and possibly the beginning of a new trend.
That is why the purpose of today's analysis is to examine the characteristics of this range-trading environment on the USDCHF, which could create advantageous trading opportunities on its own. Additionally, the review is going to highlight the most crucial price levels, whose breaking by the price action would likely signify the beginning of one such directional trend.
1. Long Term Outlook:
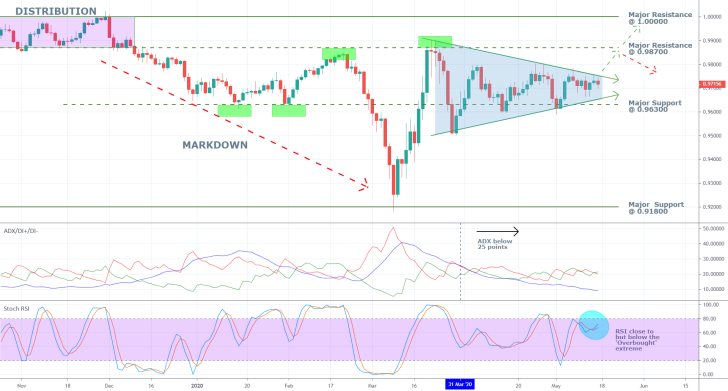
As can be seen on the daily chart below, the aforementioned consolidation range takes the form of a classic flag pattern, whose most discernible characteristic is the contracting triangle (the flag itself). Naturally, once there is no more room for the triangle to keep contracting, a breakout or conversely a breakdown is expected to take place, thereby initiating the establishment of a new directional trend – a bullish one in the first case and a bearish one in the latter.
If the price action establishes a breakout above the triangle's upper limit, then the first major test for this newly developing bullish trend would be the major resistance level at 0.98700. This was the highest point of the flag pattern –where its pole reached a peak – and thereby it represents a significant obstacle for any forthcoming upswings.
If, however, the price action manages to overcome it, then the next target would be the major resistance level at 1.00000, which has psychological importance. Moreover, this level served as the upper boundary of the preceding Distribution range, which makes it even more critical.
Conversely, there is also a chance for the price action to bounce back from the initial resistance level, which would mean that the underlying bullish commitment in the market is not significant enough. In such a scenario, the condition of the broader range would have been preserved, which would allow for the continued application of swing trading strategies.

At present, the USDCHF finds itself in the most significant range-trading environment since December of last year. This is confirmed by the ADX, which is not only threading below 25 points but is also at its lowest in over six months. As the range-trading environment becomes more pronounced, the size of the underlying price fluctuations is going to continue diminishing. This process is eventually going to be terminated by the establishment of the aforementioned breakout/breakdown.
The timing of this anticipated breakout can, therefore, be projected based on the depreciating in size fluctuations. In other words, the USDCHF is currently in the process of establishing a 'bottleneck', and once there is no more room for the price action to bounce up and down between the triangle's (flag) two edges, that is when the breakout/breakdown is likely to occur.
Meanwhile, the Stochastic RSI is currently nearing the 'Overbought' extreme, which, given the underlying range-trading conditions in the market, could signify the formation of a new downswing within the boundaries of the triangle (flag). While these conditions are maintained, each crossover on the RSI would likely signify the emergence of a new price swing within the boundaries of the triangle (flag).
2. Short Term Outlook:

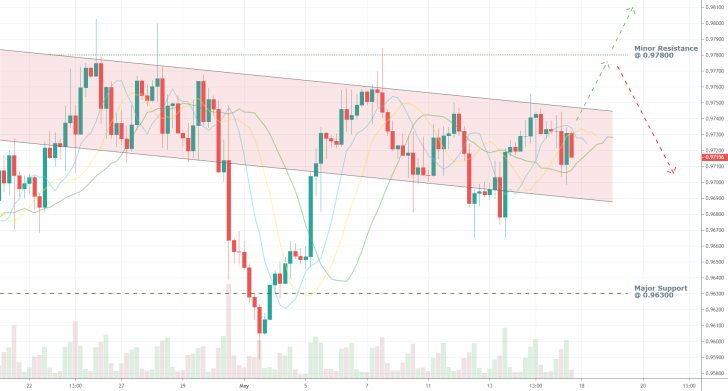
As can be seen on the 4H chart above, the price action is also contained within the boundaries of a downwards sloping channel, which could be used as a gauge for the anticipated breakout/breakdown. Any upsurge or down surge beyond the channel's limits could potentially signify the emergence of the new trend.
For the most part, each time that the price action has come near one of the channel's two boundaries, it has reversed its course, which has left prominent marks. Three candles have formed distinctive shooting stars after failing to break out above the channel's upper boundary, which is demonstrative of significant selling pressure there.
In contrast, the attempts at a breakdown have been somewhat more successful, with the price action temporarily falling below the major support level at 0.96300 before quickly reverting itself afterwards.
Therefore, traders need to be on the lookout for the establishment of an even more decisive breakout or breakdown, to definitively confirm the termination of the channel before trading strategies suitable for trending environments can be applied.
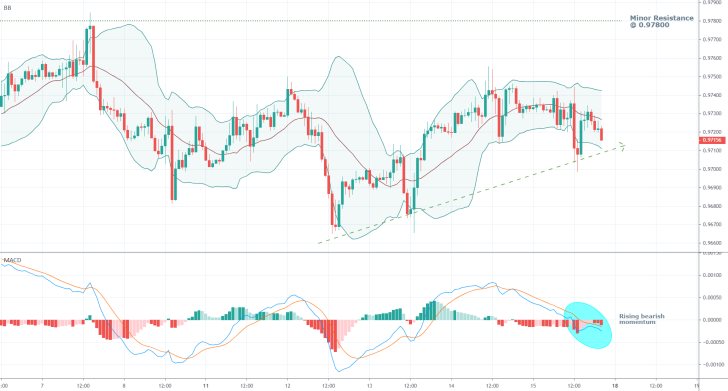
Meanwhile, the hourly chart below demonstrates that the current short term momentum is ostensibly bearish. The MACD is presently falling below the 0.000 threshold, which is illustrative of increasing bearish momentum. This, in turn, favours the emergence of a breakdown over a breakout. However, the first test for such a development would be the upwards sloping trend line presented on the chart below. Additionally, a breakdown would also have to close below the lower boundary of the channel represented on the 4H chart above. The opposite is true for any breakout north.

3. Concluding Remarks:
Overall, the USDCHF is trading within a clearly defined flag pattern on the daily chart above, and traders can continue using strategies that are adjusted to function in range-trading environments. However, they should be cautious because of the aforementioned bottleneck effect. Essentially, the narrower that the consolidation range gets, the lesser that the profitmaking opportunities from swing trading get.
Meanwhile, traders who anticipate a major breakout or breakdown beyond the flag pattern's boundaries should also be cautious. As it was demonstrated above, the market is prone to developing false movements on charts with smaller timescales despite the diminished levels of adverse volatility. They need to join a newly developing trend only after a decisive breakout or breakdown has been observed.

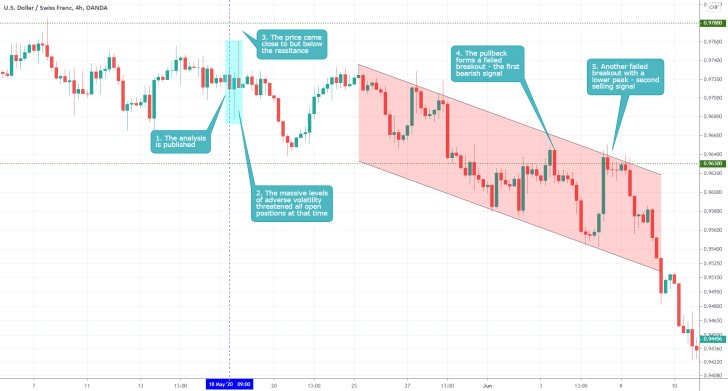
- The expectations for the formation of a flag pattern were not realised. This elucidates the discrepancy between proactive and reactive trading. It is better to trade AFTER such patterns have fully developed, rather than construe trades based on currently emerging patterns. Trading on the expectation for the emergence of such a patterns bears the risk of confirmation bias.
Disclaimer: Your capital is at risk! Trading and investing on the financial markets carries a significant risk of loss. Each material, shown on this website, is provided for educational purposes only. A perfect, 100% accurate method of analysis does not exist. If you make a decision to trade or invest, based on the information from this website, you will be doing it at your own risk. Under no circumstances is Trendsharks responsible for any capital losses or damages you might suffer, while using the company’s products and services. For more information read our Terms & Conditions and Risk Disclaimer.


