The USDCAD pair has been trading within the boundaries of a narrowly defined range since the 12th of June. The muted price action is the result of many contributing factors. Chiefly, the reopening of the US economy has led to an increase in the number of COVID-19 cases, which, in turn, has reinvigorated investors' fears over the possibility of new rounds of government restrictions.
The likelihood of such a closed cycle in which economic reopenings are followed by new coronavirus waves, which subsequently compel the government to reintroduce containment measures once again, would decrease the prospects of a V-shaped recovery. Accordingly, a protracted U-shaped recovery or even a double-dip W-shaped recovery becomes more likely. Owing to this persisting uncertainty, the strength of the dollar has been shaken over the past several weeks.
Meanwhile, the protracted consolidation of crude oil's price has deterred the stabilisation of the Canadian dollar, which continues to be pressured by uncertainties in the energy market. Thus, with the two currencies facing their own challenges, the USDCAD has formed a solid and distinctive range over the last month.
Today's trading session for the pair began with a sharp downturn, which was prompted by the recent developments in the EU. European ministers have finally managed to come to terms with each other and agree on a stimulus package mostly in the form of grants, to mitigate the impact of the coronavirus fallout on the most stricken economies in the bloc.
The euro was strengthened as a consequence of the accords in Brussels, which unsurprisingly had an adverse impact on the value of the greenback. The question now is can these developments in the EU sustain a continued depreciation of the greenback, or is today's downturn on the USDCAD going to be nothing more than a minor ripple. If this turns out to be a false breakdown, then can the markets anticipate a new reversal towards the range's upper boundary?
1. Long-Term Outlook:
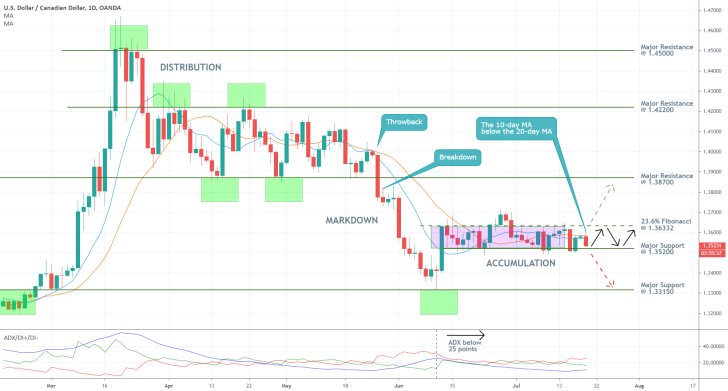
As can be seen on the daily chart below, the aforementioned range, which spans between the 23.6 per cent Fibonacci retracement level at 1.36332, and the major support level at 1.35200, also represents an Accumulation stage from a broader Wyckoff cycle. Accumulations typically follow Markdowns similar to the one outlined on the chart and precede Markups.
Hence, the longer-term expectations project the emergence of a new bullish trend. If the price action manages to break out above the range's upper limit, then the next target level would be the major resistance at 1.38700. Nevertheless, if the current Wyckoff cycle is broken and the USDCAD continues falling below the range's lower limit, then a new test of the major support level at 1.33150 could turn out to be the ultimate result. This scenario is made possible by the fact that the 10-day MA is currently trading below the 20-day MA, which indicates the prevalence of bearish sentiment at present.
Due to the robustness of the underlying range, however, the most probable outcome for the USDCAD is one in which the pair resumes its consolidation within the boundaries of the range. This assertion is backed up by the ADX indicator, which has been threading below the 25-point benchmark since the 10th of June.
Today's attempt at a breakdown cannot be used on its own as a basis for making long-term projections. Accordingly, the congruence of all examined pieces of evidence seems to confirm the expectations for continued range-trading.

2. Short-Term Outlook:
The underlying range-trading environment is quite suitable for the implementation of swing trading strategies. These should be understood as going long when the price action is concentrated around the range's lower boundary, and conversely, going short when the price action is focused around the range's upper edge.
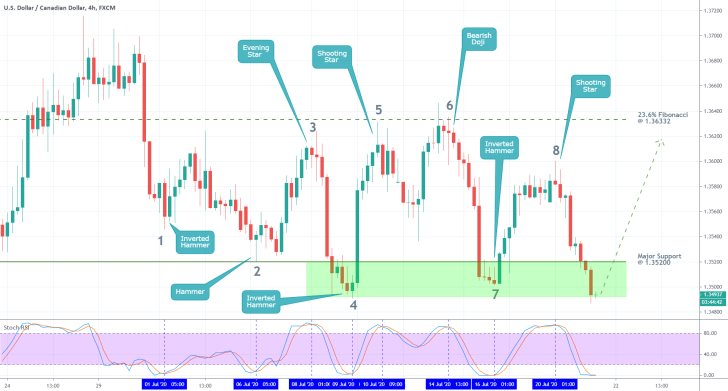
Choosing suitable entry levels can be achieved by utilising a stochastic indicator. In this case, the Relative Strength Index is used to pinpoint the exact times when the price action is ready to revert itself.
As can be seen on the 4h chart below, almost every time that the price action comes close to one of the range's edges and the RSI is correspondingly in one of its two extremes; there is a high probability for a reversal in USDCAD's underlying direction. This relationship is likely to be preserved for as long as the broader range-trading environment remains relevant.
Notice also that such reversals typically begin with a prominent candlestick pattern. Hence, seeing as how the underlying conditions are once again congruent with the aforementioned characteristics, a new reversal could potentially emerge soon.

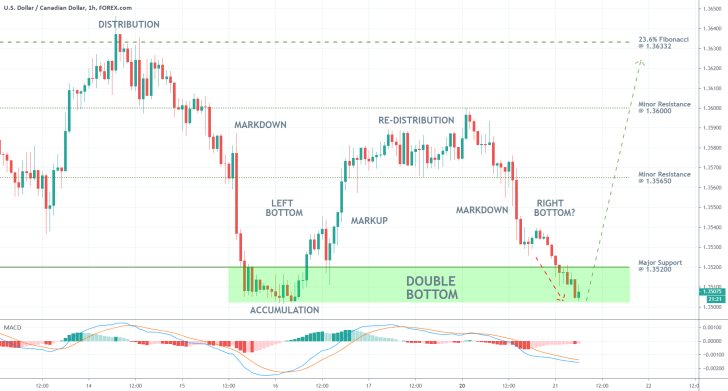
If USDCAD's price action consolidates around the current market price, this should be interpreted as a signal of strong support around the area of the last bottom. Such a course of action would also indicate the likely reversal, which, if realised, would help create a double bottom pattern. Such patterns typically entail rising bullish commitment.
Nevertheless, it should not be forgotten that at present, the underlying market moment remains prevailingly bearish, which is favourable for the continuation of the development of today's dropdown.

3. Concluding Remarks:
Overall, the range-trading sentiment of the USDCAD remains in effect for the time being. This is favourable for the implementation of the aforementioned trading approach; however, traders should not disregard the significance of recent events.
If the ongoing strengthening of the euro continues to exert an inverse impact on the value of the greenback, then today's dropdown could extend its gains further south. Therefore, contrarian traders need to wait for clear and decisive indications that the dropdown is concluded (preferably not too far off the range's lower boundary) before they start placing buying orders on the anticipation of a new reversal.

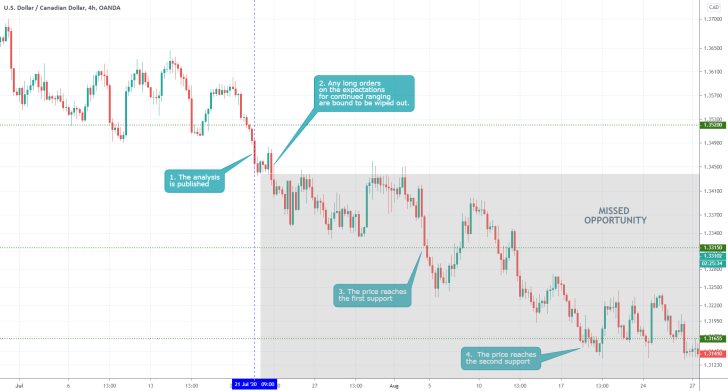
- The short-term expectations of the analysis were completely mistaken. In hindsight, however, we know that the underlying sentiment changed exactly after the publication, which was an unfortunate coincidence. The range was broken and the price started developing a new downtrend. The biggest drawback of the analysis was that it did not advise traders what to do in case that the price breaks below/above the boundaries of the range. This resulted in the massive missed opportunities. Traders should always be aware under what conditions the underlying sentiment would be changed, in which case they'd need to either completely change their position or refrain from trading altogether.
Disclaimer: Your capital is at risk! Trading and investing on the financial markets carries a significant risk of loss. Each material, shown on this website, is provided for educational purposes only. A perfect, 100% accurate method of analysis does not exist. If you make a decision to trade or invest, based on the information from this website, you will be doing it at your own risk. Under no circumstances is Trendsharks responsible for any capital losses or damages you might suffer, while using the company’s products and services. For more information read our Terms & Conditions and Risk Disclaimer.


