The EURUSD has been advancing in a solid bullish trend since the 18th of May. The bullish run itself was at least partially inspired by the flaunts of a potential vaccine against COVID-19 that were made at that time.
In addition to the sweeping enthusiasm that eased the general outlook on the global capital markets in the second quarter, other fundamental factors contributed to EURUSD's hike. On the one hand, labour market concerns in the US continue to threaten the ongoing recovery process, which, in turn, exerts a continuous toll on the strength of the dollar. On the other hand, the rampantly stabilising industry of the EU represents a significant stimulant for the rally of the single currency.
The longer-term market trends favour the continuation of EURUSD's bullish rally; however, in light of ECB's monetary policy meeting that is scheduled to take place later today, a sudden surge in the underlying volatility could prompt the emergence of a new correction in the short-term.
Therefore, the purpose of today's analysis is to examine the behaviour of EURUSD's price action and to discern the extent to which such a correction could reach from the daily peak that was established yesterday.
1. Long-Term Outlook:
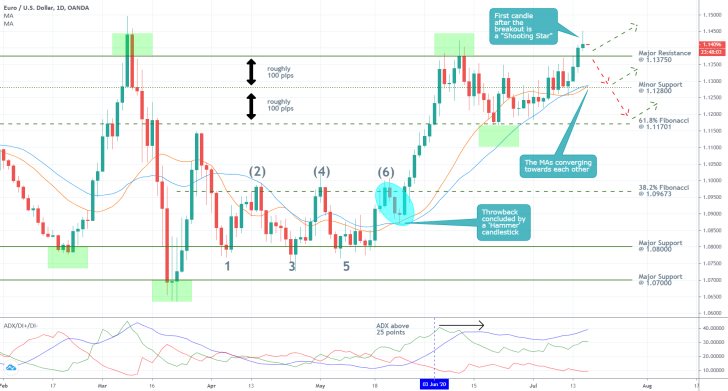
As can be seen on the daily chart below, two days ago the EURUSD finally managed to break out above the major resistance level at 1.13750. It had failed to do so on two separate occasions prior to yesterday's breakout.
Landmark developments in the establishment of any given trend, such as a breakout above a significant resistance level, oftentimes inspire the emergence of minor corrections. In other words, the underlying price action is most likely to fluctuate around such crucial levels, and this is what gives credence to the expectations for the development of a minor correction. The latter is most likely to develop now, before the broader bullish trend may resume heading further north.
The bullish trend was established when the price action finally managed to break out above the consolidation range spanning between the major support level at 1.08000, and the 38.2 per cent Fibonacci retracement level at 1.09673. This was a classic breakout play, after three failed attempts followed by a minor throwback.
Subsequently, the price action developed one massive impulse leg, which reached a peak at the major resistance level at 1.13750, before retracing back to the 61.8 per cent Fibonacci retracement level at 1.11701. This was effectively the first substantial correction in the bullish trend's development, and the present market conditions look primed for prompting another.

Two major pieces of evidence signal the interim change in the underlying market sentiment. Firstly, yesterday's trading session led to the creation of a 'Shooting Star' candlestick, which has an inherently bearish sentiment, particularly if it's found at the top of a bullish trend. Owing to the fact that such a candlestick emerged just above a prominent resistance level, points to a confluence of different pieces of evidence signalling the development of a new correction.
Secondly, the 30-day MA (in red) is now threading below the 50-day MA (in blue), which underscores the rising bearish sentiment in the market. Moreover, the two moving averages have converged towards the minor support level at 1.12800, which makes the latter the most probable target level for a new bearish correction. This is so due to the fractal nature of the price action's behaviour – the difference between the major resistance level at 1.13750 and the minor support level at 1.12800 (100 pips) is roughly the same as the difference between the latter and the 61.8 per cent Fibonacci retracement at 1.11701.
2. Short-Term Outlook:
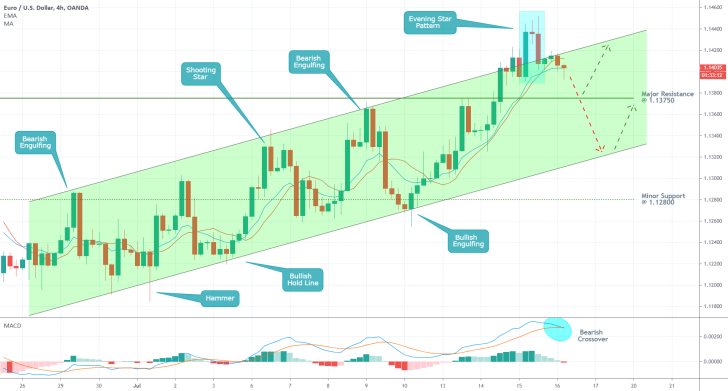
As can be seen on the 4H chart below, EURUSD's recent price action has been advancing within the boundaries of an ascending channel. It has reached the upper edge of the channel on three separate occasions, in addition to rebounding from its lower limit on three different occasions. Each time the underlying price action reached one of the channel's two boundaries, it reversed its direction by forming a prominent candlestick pattern.
In total, there are two bearish engulfing candles, one shooting star, one bullish engulfing, one bullish hold line, and one hammer. Most recently, the price action attempted to break out above the channel's upper boundary but ultimately failed to do so. An evening star pattern was established in the wake of this false breakout, which also entails bearish sentiment in the short-term. This is why the most recent behaviour of EURUSD's price action substantiates the expectations for the formation of a new bearish correction.
The bearish crossover of the 10-day EMA (in blue) with the 10-day MA (in red), coupled with the currently developing crossover on the MACD, substantiate the assertions concerning the rising bearish sentiment in the market.

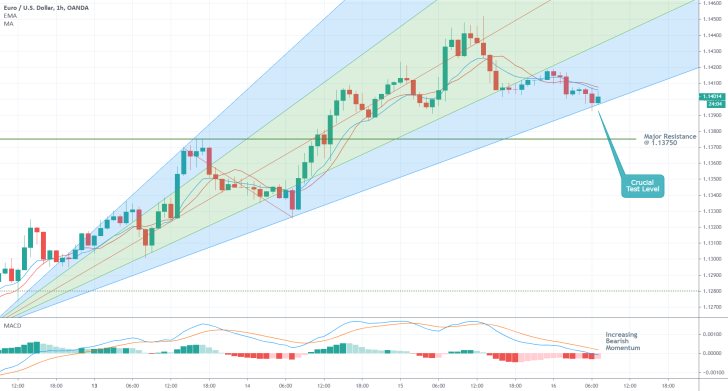
The MACD illustrates the robust bearish momentum in the very short-term, as is demonstrated on the hourly chart below. Meanwhile, the price action remains concentrated below the 10-day EMA (in blue), which is positioned below the 10-day MA (in red). All of these factors confirm the primary expectations. Finally, if the price action manages to break down below the pitchfan tool's lowest limit, this would represent yet another piece of evidence supporting those same expectations.

3. Concluding Remarks:
Utilising the current situation on the EURUSD is not going to be easy, but it entails favourable prospects. Traders need to wait and see how the ECB meeting goes, and then potentially join the market following the release of the monetary policy statement.
Contrarian trading involves its own risks; however, with a certain degree of caution and tight entry and exit levels, the market bears could exploit the situation and trade on the currently developing correction.

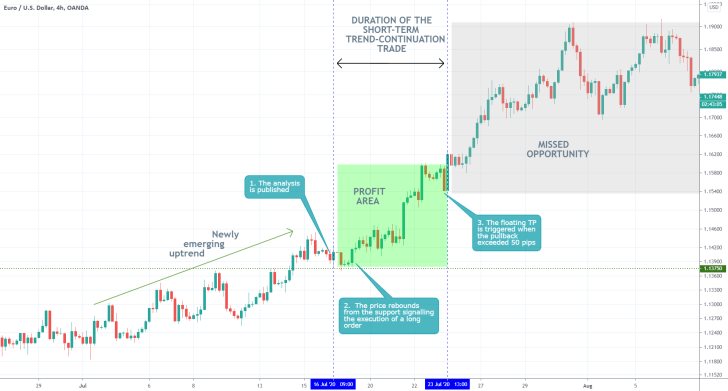
- The short-term projections of the analysis were very good with excellent T.A. The longer-term projections, however, were lacking breadth, which limited the profits of the trade. The analysis should have done more in outlining the prospects of the evolving uptrend at that time.
Disclaimer: Your capital is at risk! Trading and investing on the financial markets carries a significant risk of loss. Each material, shown on this website, is provided for educational purposes only. A perfect, 100% accurate method of analysis does not exist. If you make a decision to trade or invest, based on the information from this website, you will be doing it at your own risk. Under no circumstances is Trendsharks responsible for any capital losses or damages you might suffer, while using the company’s products and services. For more information read our Terms & Conditions and Risk Disclaimer.


