In our comprehensive take on yesterday's stock market crash that was published earlier today, we demonstrated the fragile nature of S&P's bullish run. The speculative nature of yesterday's crash was exposed, and it was alluded to the possibility for the implementation of swing trading strategies given the current context of the market.
The nearly 6 per cent plunge of the S&P is owing to the sudden but substantial change in the underlying trading volume that was executed, as investors and traders scrambled to leave the market on renewed fears concerning the coronavirus pandemic. All of this resulted in the massive upsurge of adverse market volatility, which is encompassed by the rise of the VIX (demonstrated on our most recent market update's chart).
It is exactly because of this underlying volatility that S&P's price action can be anticipated to form new swing lows and swing highs over the next several days, as the US stock market starts to price in the most recent coronavirus developments.
That is why the purpose of today's analysis is to highlight the most prominent support and resistance levels, and thereby, to delineate on the most likely turning points that could mark the dips and peaks of those new swings.
1. Long-Term Outlook:
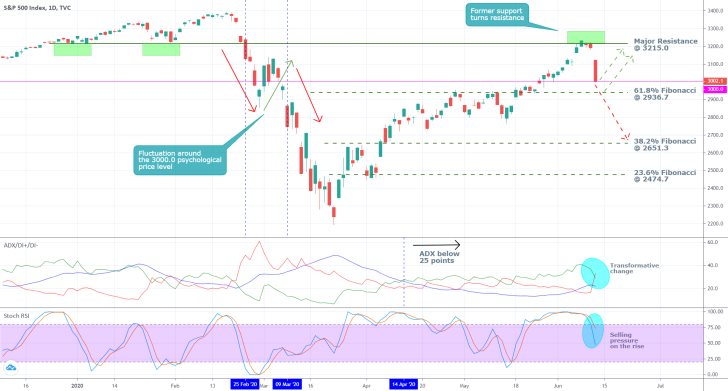
As can be seen on the daily chart below, yesterday's plunge was initiated from the major resistance level at 3215.0, which served as a prominent support level prior to the earlier coronavirus market crash. Given the scale and timing of yesterday's fall, many traders have started to weigh in on whether this dropdown would mark the end of the bullish run that has been developing since early April.
The first significant indication of that is going to be the price action's behaviour around the psychologically important 3000.0 level. Yesterday's trading session formed a dip precisely at this psychologically-fused barrier, which is giving market bulls hope that a sharp rebound could emerge after today's open.
However, there is also another possible scenario. Examining the behaviour of the price action around this crucial level in the period between the 25th of February and the 9th of March underlines the extra uncertainty that is typically found around such psychologically important barriers. Back then, following the initial breakdown, the price action promptly retraced back above the 3000.0 support so that the downturn could be continued afterwards.
If such a behaviour is to be expected this time as well, then one or two breakouts and breakdowns around the level could develop once again, before a more substantial downturn could form. Consequently, depending on how the market prices in the renewed fears for a second coronavirus wave, the price action could go in one of two directions.
It could either swing back up towards the major resistance level at 3215.0 or it could consolidate temporarily between the 3000.0 price level and the 61.8 per cent Fibonacci retracement at 2936.7, before a more substantial downswing could form towards the 38.2 per cent Fibonacci retracement level at 2651.3. Notice also that the close proximity of the 3000.0 level with the 61.8 per cent Fibonacci, which is the nearest major Fibonacci retracement to yesterday's dropdown, makes a sharp rebound back up seem highly plausible.

The ADX is near but below the 25-point mark, which means the market is still technically range-trading. Nevertheless, the recent crossover between the DI- and DI+ underlines the significance of yesterday's dropdown. Thereby, it could also highlight the beginning of a new bearish trend. Meanwhile, the Stochastic RSI demonstrates the rising selling pressure in the market, which would favour the establishment of a new major breakdown.
2. Short-Term Outlook:
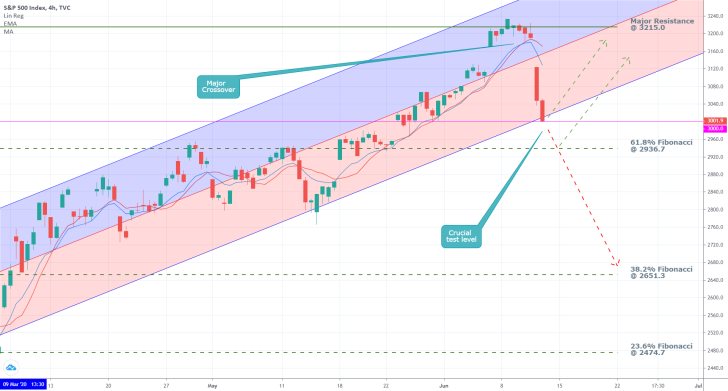
As can be seen on the 4H chart below, there is another reason substantiating the expectations for a snap rebound after today's market open. The trading session yesterday was concluded after the price action had reached the psychologically important 3000.0 level, which coincides with the ascending channel's lower boundary. This is typically where snap reversals are expected to form.
However, the 10-day EMA (in blue) has already crossed below the 10-day MA (in red), which means that the short-term momentum is already undergoing a transformative change. If this relationship is maintained, then the continuation of the recent dropdown can be expected to be the most probable result.

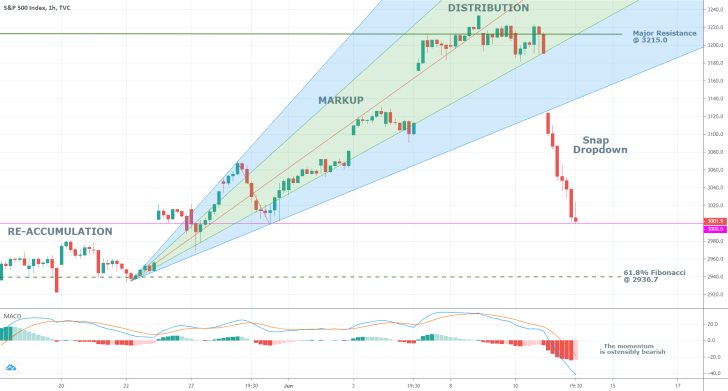
As can be seen on the hourly chart below, the price action is about to enter into the area of the last minor Re-Accumulation range. The latter had the psychological 3000.0 level as its upper boundary and the 61.8 per cent Fibonacci retracement level as its lower boundary.
This means that despite the snap dropdown from yesterday, which is considerable in size when compared to the last Markup, the price action is about to enter into an area which has already changed the underlying market sentiment once. Consequently, a new consolidation between the two aforementioned boundaries is likely to occur once again, which could deter the market from continuing to fall. Accordingly, such a consolidation could be followed by a renewed bullish upswing.
Special attention, however, should be given to the underlying market momentum. The MACD is presently demonstrating quite robust bearish momentum, which favours the continuation of the dropdown's establishment below the 61.8 per cent Fibonacci retracement level, which is serving as a prominent support.

3. Concluding Remarks:
Overall, the volatility on the S&P 500 is likely to remain heightened over the next several days, as traders and investors continue to weigh in on the latest coronavirus developments in the US and elsewhere. This would create the perfect conditions for the emergence of new significant price fluctuations, which, in turn, can be used by swing traders.
However, this environment could also foster the transition of the market from being bullishly-oriented towards having bearish inclinations. In other words, on the condition that the general market outlook continues to deteriorate, the S&P could promptly resume falling.
Disclaimer: Your capital is at risk! Trading and investing on the financial markets carries a significant risk of loss. Each material, shown on this website, is provided for educational purposes only. A perfect, 100% accurate method of analysis does not exist. If you make a decision to trade or invest, based on the information from this website, you will be doing it at your own risk. Under no circumstances is Trendsharks responsible for any capital losses or damages you might suffer, while using the company’s products and services. For more information read our Terms & Conditions and Risk Disclaimer.


