Yesterday the American stock market experienced its worst selloff in a single day since the Black Monday of 1987. The S&P 500 tanked with 9.50 per cent, and with that considerable drop it wiped out nearly all of the gains that had been accumulated throughout 2019. The index is currently trading around 2480 points; which level was last tested in January of the previous year.
Some experts were quick to assert that the market has now officially turned bearish, which is a challenging argument to contest. The economy is currently exhibiting all signs of entering into a significant bearish market. Nevertheless, technically there is still some hope for a quick turnabout. As it is about to be seen below, the S&P has to break down below one additional support level, before the current bearish correction (technically the selloff is still a corrective swing) can be labelled as a new markdown.
In his most important presidential speech as of yet, Donald Trump addressed the nation by outlying his plan for tackling the issue. He dismissed the assertion that the situation is leading to an economic crisis, and instead insisted that “this is just a temporary moment of time that we will overcome as a nation, and as a world”. In addition to his reassuring rhetoric, Trump announced the measures that are currently being taken in an effort to increase the overall liquidity in the country and support the economic activity.
The US is now once again on a path to stepping up its quantitative easing program on a scale that was unprecedented since the 2008 credit crunch. All of these decisions in addition to the volatile nature of the constantly evolving situation are bound to impact the S&P 500 in a profound way, that is going to have a noticeable imprint on the global economy in the long run.
That is why the current analysis aims to highlight the most recent developments concerning America's most significant stocks index and underpin the most likely influences that are bound to impact its price in the short run. It wouldn't be an overstatement to say that the American economy, in addition to other national economies worldwide, presently find themselves at a crossroads that were last seen over a decade ago.
1. Long Term Outlook:
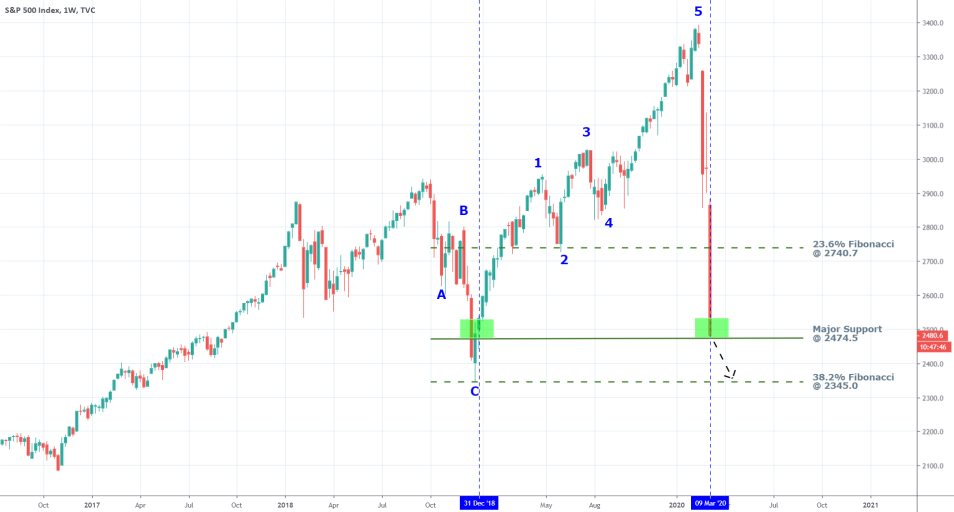
From the weekly chart below, it can be seen that in little over three weeks, the S&P wiped out nearly all of its value that was accumulated since the beginning of 2019. The selloff reached the major support level at 2474.5, which is close to the dip that was reached during the previous substantial correction on the market. That is why, technically speaking, until the current swing manages to break down and close below set support level, the market still cannot be characterized as being fully bearish. This, in turn, sparks faint hopes that the selloff can still be averted relatively quickly and stocks may yet bounce back up.

As per usual, Elliott Wave Theory can be employed to characterize the behaviour of the price action in trending environments. The theory postulates that typically, all 1-5 impulse waves – regardless of whether they are bullish or bearish – are followed by an ABC correction in the opposite direction to the existing trend. Thereby, the recent selloff should be a correction to the 1-5 impulse wave pattern that developed over the period from Early-January 2019 to Late-March 2020. It, however, does not behave as such, which supports the general fears that the price may continue going further south.
The steep angle of the dropdown coupled with the apparent lack of any pullbacks is exhibitive of a very robust selling pressure, which is very likely to support the continuation of the selloff. There are two barriers remaining, which could act as potential turning points for the direction of the underlying price and thereby prevent any further losses. The first one is the aforementioned major support level at 2474.5, and the next one is the 38.2 per cent Fibonacci retracement at 2345.0, which is serving as the last crucial level of support. Its significance is bolstered by the fact that in addition to being a major Fibonacci number, it is also where the previous ABC correction was exhausted, and a dip was formed at point C.
2. How Efficient Could Quantitative Easing Become?
FED reacted promptly to the coronavirus fallout by cutting the federal funds rate to 1.25 per cent on an emergency meeting of the FOMC that took place on the 3d of March. In addition to that, the Committee also decided to increase the capacity of its asset purchasing program, which is more commonly known as quantitative easing.
“The Committee also directs the Desk to continue conducting term and overnight repurchase agreement operations at least through April 2020 to ensure that the supply of reserves remains ample even during periods of sharp increases in non-reserve liabilities and to mitigate the risk of money market pressures that could adversely affect policy implementation. In addition, the Committee directs the Desk to conduct overnight reverse repurchase operations."
Such programs are quite comprehensive and require intricate investigation that would exceed by far the scope of the current analysis. The consequences from the programs, however, could be summarized broadly to shed more light on the most likely outcome for the S&P 500.
In essence, quantitative easing aims to increase the aggregate money supply in the economy – more liquidity. By doing so, loans become more readily available to investors, and the borrowing costs fall down. This is good for businesses and entrepreneurs, who can now borrow capital for less and reinvest it in projects that, in theory, would boost the aggregate economic activity and thereby stimulate growth. The theory suggests that more liquidity in the economy would be an incentive for investors and businesses to step up their activity, which is anticipated to speed up the business cycle. The program also affects savers, chiefly pensioners, as they now receive smaller interest on their savings.
It is postulated that quantitative easing is a governmental mechanism that is best used at times of economic stagnation or recession, to reinvigorate the general economic activity. The model is frequently explained in academic circles by a comparative model – using jumper cables to restart the battery of a faulty car, in which the jumper cables represent the asset-purchasing program and the car is the economy.
According to theory, all of these efforts by the FED should kick start the shaken economy and subsequently stop the stock market rout. In practice, however, the consequences of the reinvigorated quantitative easing program are far more ambiguous. That is so because more liquidity in the economy does not necessarily mean that the underlying economic activity would be bolstered. And even if it is, just because more businesses borrow cheaper capital to expand their operations, it does not automatically mean that their ideas are going to pan out and make profits. Not all businesses are going to turn profitable in the long run, which means that the expected payoff from the higher liquidity levels would not necessarily meet the expectations for economic growth.
A crucially important thing to consider is the willingness of borrowers to be proactive at times of great market uncertainty; whether the bigger money supply in the economy is going to be a sufficiently appealing incentive for them to start borrowing cheap capital at times when the market is trying to find a new equilibrium.
Even more importantly, if the US starts to follow the example of China and Italy in implementing lockdowns in affected areas, economic activity is going to be lessened with or without the bigger money supply. Hence, the ultimate success of FED's policy is going to depend on two things. In essence, investors’ understanding of the current market uncertainty brought about by the coronavirus, and also by the practical implications from potential lockdowns in the states.
3. Short Term Outlook:
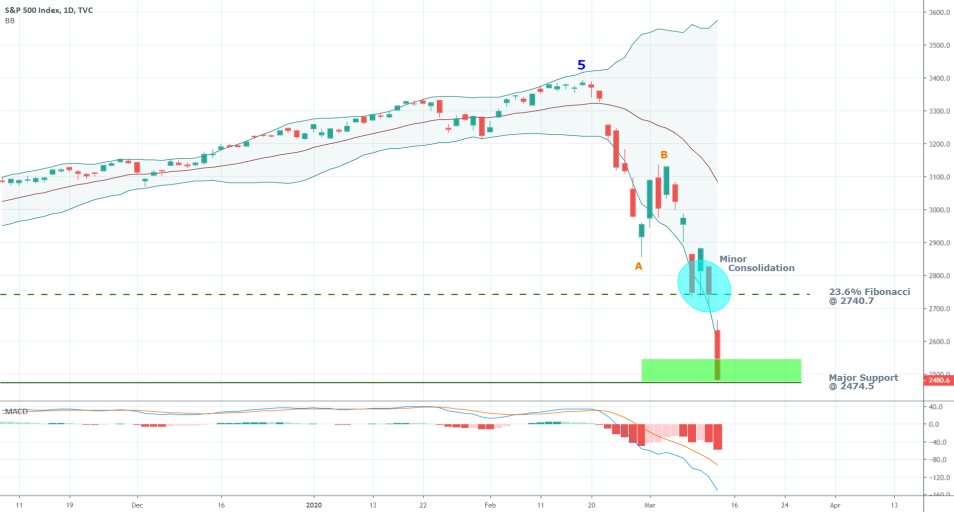
As can be seen on the daily chart below, the selloff was temporarily held in a short consolidation range above the 23.6 per cent Fibonacci retracement level at 2740.7. This was prior to yesterday’s tumble and is demonstrative of two things.

Firstly, the market is desperately attempting to find support so that the rout can be invalidated, and a new rally might occur. Secondly, the highly volatile and reactive market environment is prone to bolstering the size of the price swings. That is why yesterday’s tumble, which was initiated after Donald Trump’s speech was received with pessimism by the market, was so massive and swift.
On the one hand, the selloff on the daily chart is showing some signs that a minor ABC correction might yet form, which is an optimistic outlook driven by the anticipation for a dip. This increases the importance of the two aforementioned support levels and their roles as potential turning points for the price action even more. On the other hand, the MACD is exhibiting the decidedly bearish momentum on the market, which seems to be mounting up. This would only increase the likelihood for the continuation of the downtrend.

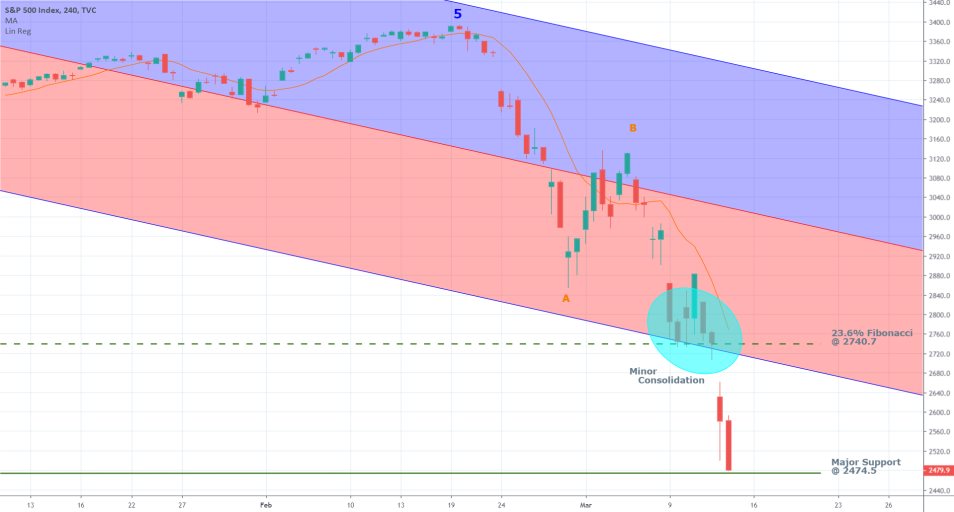
Unlike with other financial instruments, the 4H charts of major indices can provide limited insights into the behaviour of the price action due to the fewer market hours during which trading is active. In the current case, the 4H chart only confirms the previous attestations. It can be seen that once the minor consolidation range was terminated and the price broke down below the 23.6 per cent Fibonacci retracement, it also broke down below the regression channel’s lower boundary. This serves to confirm the increasing bearish momentum over the last few days.
4. Concluding Remarks:
The next few weeks are going to be imperative for the global efforts in the battle to contain the spread of the coronavirus. If they succeed and evidence starts surfacing that the outbreak has moved past its peak globally, similar to what happened in China, investors’ optimism is undoubtedly going to return to the markets, which would likely bolster the S&P. Until then, the situation would likely remain too volatile and unpredictable to project any potential scenarios for the S&P as well as for stocks in general. That is why trading at the present moment on major indices and stocks entails significant risks, that, arguably, do not justify the execution of any trading positions.

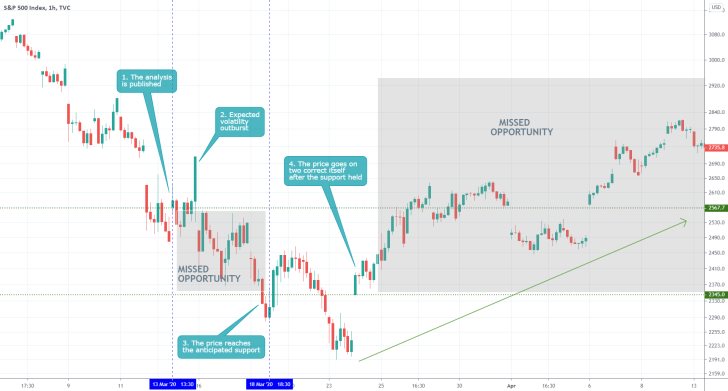
- The analysis cautioned against the dangers of volatile markets that are driven by uncertainty. As can be seen on the chart above, this uncertainty prompted the creation of many volatility outbursts that could have wiped out many positions. Even still, the analysis failed to point out different ways in which the impact of this adverse volatility could have been mitigated while still catching the price swings. The analysis quite accurately pointed out the likely support level which was indeed reached by the downturn; it also anticipated correctly the subsequent bullish correction. Massive profits could have been made if the analysis had suggested the implementation of options to hedge the volatility risk, while still catching the directional movements. The big takeaway from this is that traders could implement various types of financial instruments for different types of market environments; they do not necessarily have to use only one type. Options can be used with great success during really volatile periods on the market, as well as at times when there seems to be no volatility at all.
Disclaimer: Your capital is at risk! Trading and investing on the financial markets carries a significant risk of loss. Each material, shown on this website, is provided for educational purposes only. A perfect, 100% accurate method of analysis does not exist. If you make a decision to trade or invest, based on the information from this website, you will be doing it at your own risk. Under no circumstances is Trendsharks responsible for any capital losses or damages you might suffer, while using the company’s products and services. For more information read our Terms & Conditions and Risk Disclaimer.


