The stars finally seem to be aligning favourably for the European stock market. Most states within the EU have started to reopen their economies, which allows for the general economic activity to begin normalising gradually. There are also positive indications for the swift development of a drug for COVID-19, as well as a vaccine for treating the SARS-Cov-2 pathogen. Both of these developments are needed for the eventual overcoming of the health crisis.
Finally, after the recent announcement that France's Emmanuel Macron and Germany's Angela Merkel have reached an agreement to raise common debt of 500 billion euro in order to support the jolted fragments of the European industry, the markets received yet another reason to remain optimistic. Investors can now believe that the EU stands fast amidst the coronavirus crisis with a clear roadmap for overcoming the present tribulations.
In line with all of these positive developments, European stocks have also begun to stabilise, with some market experts anticipating the continuation of the current bullish correction. Some of the more optimistic forecasts even project the bullish run to invalidate the losses that were accumulated in the early days of the market crash.
For today's analysis, we have opted to examine the price action of the French CAC 40 composite index, which is one of the flagships of the European stock market, and to highlight what such a path to full recovery may look like.
1. Long Term Outlook:
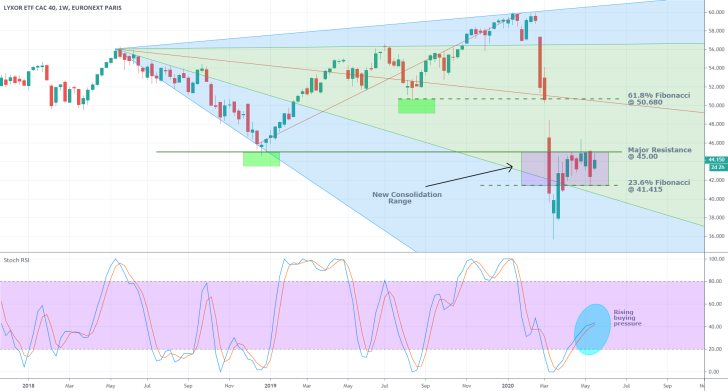
As can be seen on the weekly chart below, the pitchfan tool is used to measure the scope of the recent market selloff, and thereby to underpin the most crucial price levels in an eventual recovery. The first major cue signifying the termination of the selloff is the bounce of the underlying price action back up into the middle territory of the pitchfan (in light green) over the last several weeks.
The recent consolidation commenced after a turbulent retracement of the price action back above the downwards sloping trend line that separates the lowest segment of the pitchfan from its middle ground. This is the most substantial confirmation for the likely beginning of a new dominant bullish run.

The current consolidation range has two distinctive limits. The major resistance level at 45.00 represents its upper boundary, and the 23.6 per cent Fibonacci retracement level at 41.415 represents its lower boundary.
It should also be noted that the former coincides almost perfectly with the 38.2 per cent Fibonacci retracement level (it is not explicitly plotted on the chart above), which makes the level an even more prominent resistance. Furthermore, the 45.00 level has already acted as a significant turning point for the underlying direction of the price action, as highlighted by the first green rectangle. The prominence of the level is thereby bolstered even more by the fact that this first reversal delineated the lowest limit of the aforementioned pitchfan.
Hence, the price action is going to struggle to break out above the major resistance level at 45.00 –there have already been several failed attempts over the last few weeks. However, if it succeeds in doing so, this would be yet another considerable evidence of rising bullish sentiment in the market. On the other hand, failing to do so would be illustrative of diminishing buying pressure in the short term, and thereby signify the renewed headwinds for the index.
The Stochastic RSI favours the establishment of an imminent breakout, as it indicates rising buying pressure in the market. Should the price action manage to break out above the pivotal 45.00 level, its next logical target is going to be the 61.8 per cent Fibonacci Retracement level at 50.680. Its importance is further bolstered by the fact that it coincides with the pitchfan's middle trend line. Conversely, a breakdown below the 23.6 per cent Fibonacci retracement level at 41.415 is going to represent a substantial indication for rising selling pressure in the market and potential continuation of the preceding selloff.
2. Short Term Outlook:

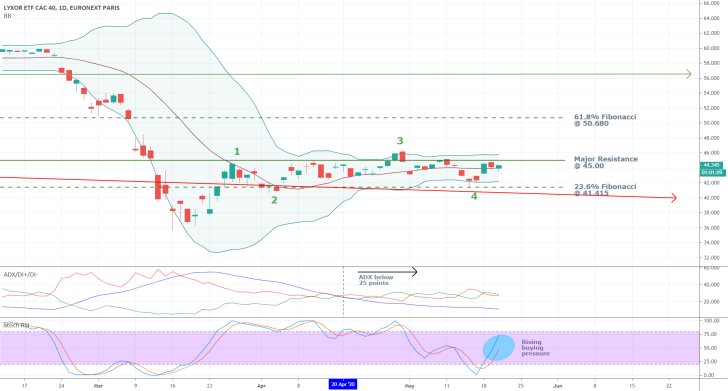
As can be seen on the daily chart above, the bullish correction that was initiated at the lowest part of the preceding crash resembles a classic 1-5 impulse wave pattern, postulated by the Elliott Wave Theory. Judging by that, a final 4-5 impulse leg is likely to form, which could propel the price action above the major resistance level at 45.00.
The ADX is currently threading way below the crucial 25 points threshold, which confirms the condition of the aforementioned consolidation range. It also favours the execution of swing trading strategies while the price action remains confined within the range's boundaries.
However, swing traders should not forget that the market is bracing for a new attempt at breaking out above the aforementioned resistance, so a new and definite trending environment could promptly substitute the range-trading condition of the market. The appreciating Stochastic RSI, which demonstrates rising buying pressure in the short term as well, supports these anticipations.
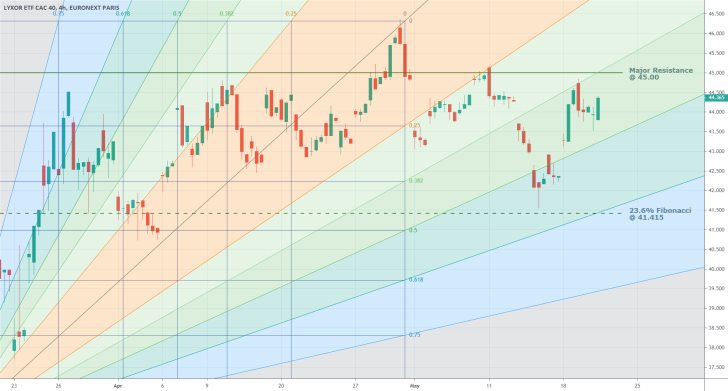
The Fibonacci resistance fan on the 4H chart below confirms the rising bullish momentum in the short term, with the price action recently bouncing back up from the fan's 38.2 per cent level. The price action is currently consolidating above the fan's 23.6 per cent retracement level and the aforementioned major resistance at 45.00, which attests to the final stage in preparation for a new and decisive break out further north. However, it remains to be seen whether all of the observed bullish commitment in the market is going to be enough for achieving the goal at hand.

3. Concluding Remarks:
Most of the underlying fundamentals seem to favour the continuation of the CAC 40's price action further north. The observed technicals are also congruent with such expectations; however, the possibility of intermediate downswings forming to or below the major support level at 41.415, represented by the 23.6 per cent Fibonacci retracement level, should not be ignored by traders.

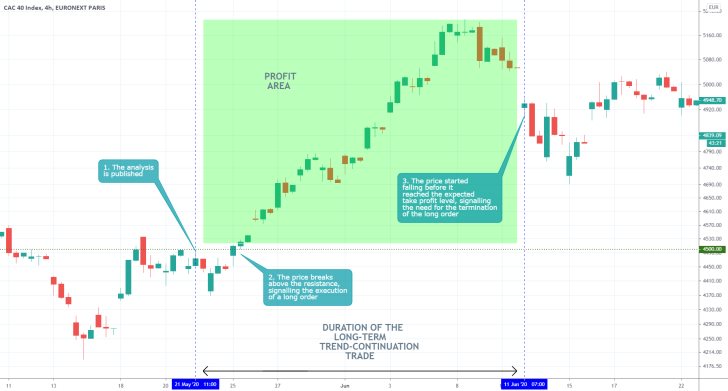
- Overall, excellent trade. The price started to appreciate almost immediately after the publication of the analysis, as per the initial expectations. It, however, failed short of the initially projected resistance level at 50680.00. This highlights the need of using floating stop losses, to protect the underlying position against sudden changes in the direction of the price action. Sometimes, the floating stop-losses are going to cut the running profits short, but others they are going to enhance them, as is the case above. That is why each trader needs to determine for himself under what conditions to implement them, depending on his level of risk-aversion.
Disclaimer: Your capital is at risk! Trading and investing on the financial markets carries a significant risk of loss. Each material, shown on this website, is provided for educational purposes only. A perfect, 100% accurate method of analysis does not exist. If you make a decision to trade or invest, based on the information from this website, you will be doing it at your own risk. Under no circumstances is Trendsharks responsible for any capital losses or damages you might suffer, while using the company’s products and services. For more information read our Terms & Conditions and Risk Disclaimer.


