Crude oil has been consolidating in a tight range ever since our previous analysis of the commodity's price action. This is partly due to the gradually increasing aggregate demand worldwide, as governments ease their restrictions, and partly due to the recovering industrial activity.
Moreover, the supply glut from the beginning of the coronavirus crisis, which inspired the crash in the energy market, is now completely offset, because of OPEC's timely intervention. All of the underlying fundamental factors are now favourable for the continued stabilisation of the energy market, and crude's price is likely to continue appreciating.
Before the bullish run is resumed, however, the underlying price action would have to break out above yet another crucial resistance level. Thereby, the purpose of today's analysis is to examine the currently developing breakout play on crude's price and to underscore the most likely manner in which the market is expected to proceed advancing further north.
1. Long-Term Outlook:
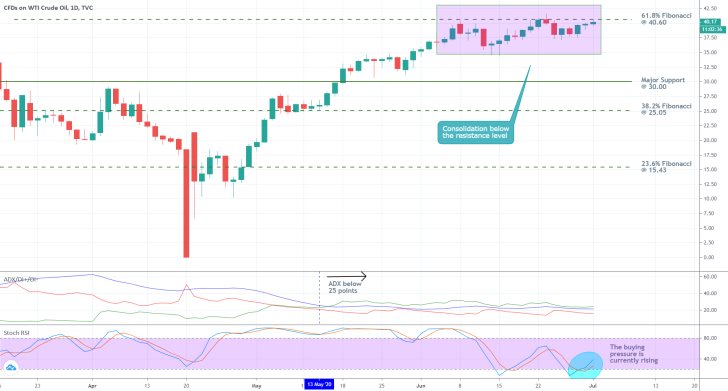
The daily chart below represents the narrow consolidation range that is presently evolving just below the 61.8 per cent Fibonacci retracement level at 40.60. It can be clearly seen how the price action is converging towards the resistance level, which could be interpreted as a distinctive piece of evidence that the market is preparing for another attempt at a decisive breakout.
Moreover, this resistance level encapsulates the last significant Fibonacci retracement level that the market needs to overcome following the conclusion of the previous crash. In other words, the 61.8 per cent Fibonacci retracement level represents the most substantial test for the current bullish run yet. If the price action manages to break out above it, this will entail a significant confirmation of the underlying bullish commitment in the market.
Conversely, if the underlying fundamentals were to change suddenly and the underlying price action was to start depreciating, then the next level on which the market could find the necessary support for another trend reversal is the major support at 30.00. The latter has psychological importance due to the three zeroes in the number. The same thing can be said about the 61.8 per cent Fibonacci retracement, which is positioned quite close to the 40.00 benchmark.

The ADX indicator has been threading below the 25-point benchmark since the 13th of May, which is to be expected given the aforementioned consolidation. This behaviour is demonstrative of the current range-trading sentiment in the market, which is likely to be followed by a decisive breakout. Of course, this is dependent on the preservation of the underlying fundamentals.
Meanwhile, the Stochastic RSI indicator has recently moved away from the 'Oversold' extreme, which highlights the rising buying pressure in the market. Both indicators are demonstrating behaviours that are inlined with our primary expectations.
2. Short-Term Outlook:
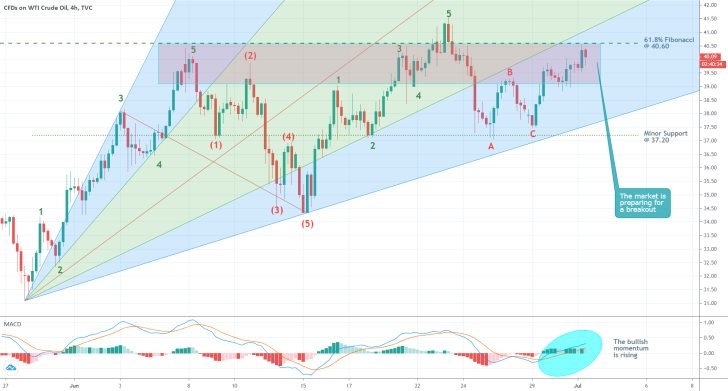
As can be seen on the 4H chart below, the aforementioned consolidation area below the 61.8 per cent Fib. Its represented as a pink rectangle. Notice also that the lowest limit of the pitchfan tool is currently positioned above the minor support at 37.20, which makes the emergence of a hypothetical downswing seem less likely.
The behaviour of the underlying price action is also studied using the Elliott Wave Theory. It has formed three consecutive 1-5 impulse wave patterns (two bullish ones separated by a bearish one), which were followed by an ABC correction. This type of behaviour is evocative of the market's fractal nature and presupposes the likely continuation of crude's appreciation above the aforementioned resistance level.

In other words, now that the corrective ABC pattern is concluded as well, the price action is ready to attempt once again at breaking out above the resistance. Accordingly, the MACD indicator manifests the rising bullish momentum in the short term, which is a necessary prerequisite for such an attempt.
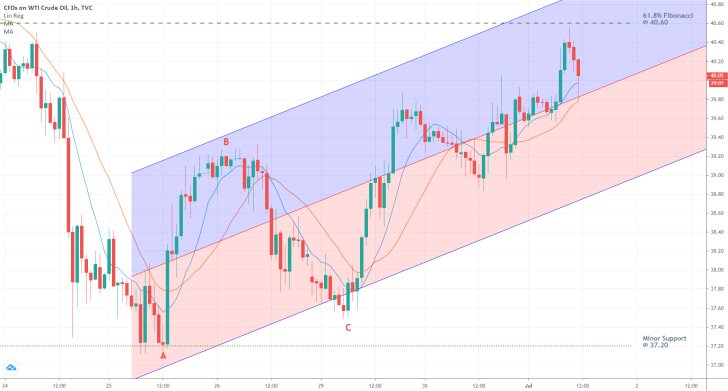
Finally, the hourly chart below demonstrates the behaviour of the underlying price action in the very short term. As can be seen, it remains concentrated above the middle line of the ascending channel. This behaviour is demonstrative of prevailingly bullish market commitment in this timeframe.
Additionally, the price action remains trading above the two prominent moving averages – the 10-day MA (in blue), which is positioned above the 20-day MA (in red). This relationship is also evocative of the strong bullish commitment in the market. In the meantime, the two moving averages' convergence towards the ascending channel's middle line is illustrative of solid support around those levels. A definitive breakdown below the three seems unlikely, though the price action might attempt to test their strengths in the near future.

3. Concluding Remarks:
The price of crude oil looks ready to attempt breaking out above the 40.60 resistance level, and the underlying fundamental factors support those expectations. However, it should not be forgotten that the market is not trending as of yet. The prevailing sentiment remains range-trading, which means that there could still be some time before set breakout is concluded. Moreover, the underlying price action is prone to fluctuating without any clear conviction under such range-trading conditions, which is why the market bulls should be prepared for sudden and erratic price fluctuations.

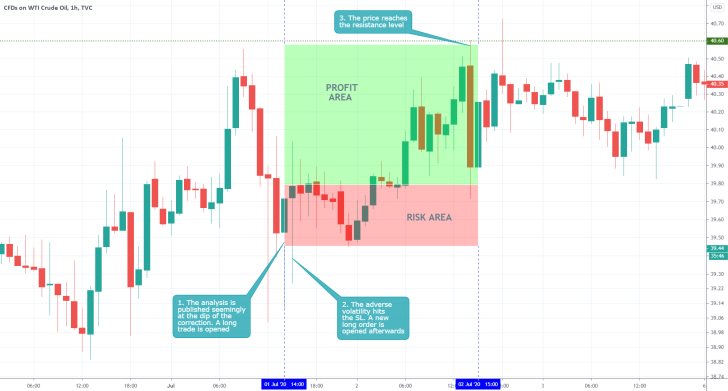
- The analysis did a good job of cautioning against the heightened volatility that was prevailing in the market around the time of publication. It was also correct in saying that the price action was about to test the resistance at 40.60, which allowed for the execution of the trade. However, it could have done more in explaining what would happen with the price if it rebounded from the resistance. Moreover, the analysis could have been a little bit more long-term oriented.
Disclaimer: Your capital is at risk! Trading and investing on the financial markets carries a significant risk of loss. Each material, shown on this website, is provided for educational purposes only. A perfect, 100% accurate method of analysis does not exist. If you make a decision to trade or invest, based on the information from this website, you will be doing it at your own risk. Under no circumstances is Trendsharks responsible for any capital losses or damages you might suffer, while using the company’s products and services. For more information read our Terms & Conditions and Risk Disclaimer.


