Gold has always been in the limelight whenever the markets get scared, and talks of a new recession are circulating the media. As a safe-haven asset, gold draws investors' attention at times of general market unrest because it can be used to hedge against market uncertainty and rising trading risks.
In the days leading up to the announcement of a global COVID-19 pandemic, the precious commodity had climbed to 1700 dollars per troy ounce – a level that was last reached in December of 2012. The rally was prompted by fear of the unknown – investors scrambling into havens in a bid to protect themselves against a worst-case scenario, at a time when the situation is changing fast, and the underlying conditions of the threat are continually evolving.
After the price reached that psychological level of 1700, it started tumbling at the height of the coronavirus panic that is still suffocating the global economy. This might seem counterintuitive at first glance, but there is sound logic behind the tanking gold price. Furthermore, this new behaviour of the metal could illustrate the changing nature of the underlying financial threat to global growth, which, in turn, can be used by traders and investors to prepare themselves for what is to come next.
That is why the purpose of the current analysis is to focus on this new paradigm in the market for gold and to examine the potential consequences for the price of the commodity from the undergoing market rout.
1. Long Term Outlook:
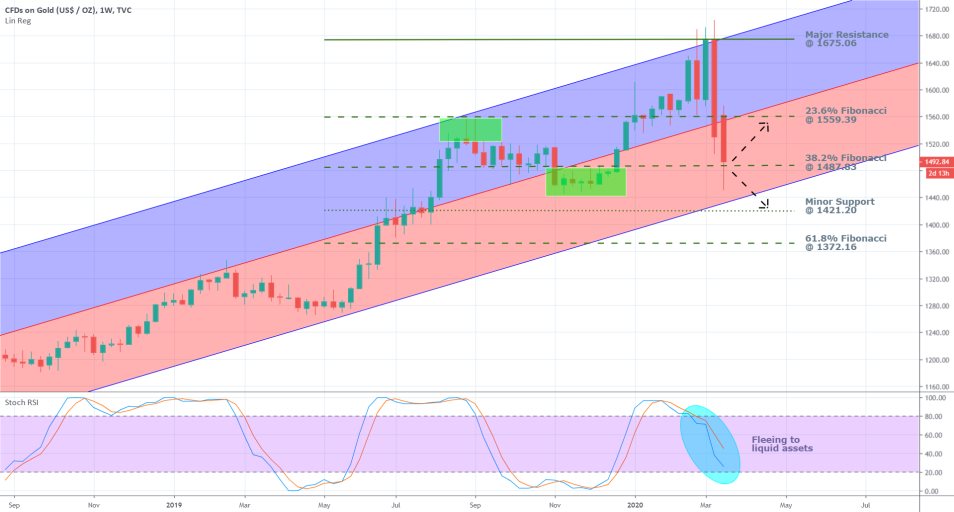
As can be seen from the weekly chart below, the price had been trading in an ascending channel, which was initiated in mid-October 2018. This was right about the time of the US Government Shutdown and the beginning of the escalations in the US/China trade relationship. Hence, the Coronavirus scare, which has gripped markets in the last few weeks, is only the newest addition to a string of events that have prompted the heightened demand for the haven before the outbreak of the pathogen.
The present week’s price action managed to break down below the 23.6 per cent Fibonacci retracement at 1559.39, which coincided with the channel’s middle line. The breakdown propelled the price in the lower part of the channel, which is illustrative of strengthening bearish sentiment in the market.
The fact that the channel’s middle line coincided with the Fibonacci support, and the breakdown penetrated them both at the same time, is demonstrative of strong selling commitment. Such behaviour makes an eventual pullback within bullish territory seem unlikely at present.
For the time being, the price is struggling to break down below the 38.2 per cent Fibonacci but has tested the level’s strength, judging by the existence of the long lower shadow of the last candlestick. The mounting selling pressure makes it seem like it is a question of time before the price manages to break down below it, possibly by the end of the week.
Due to the fact that the underlying market pressures are constantly changing, two possible outcomes can be projected. The price can either spike back up to the 23.6 per cent Fibonacci (and the channel’s middle boundary), or it can head south below the channel’s lower boundary ant the minor support level at 1421.20.
The Stochastic Relative Strength Index (RSI) is demonstrating the aforementioned selling pressure that is currently rising. The indicator is typically used in range trading environments, and the price of gold is clearly not in one right now. Regardless, the indicator is still useful in one crucial way – it alludes to the most recent tendencies in the market. Chiefly, that investors are fleeing from safe-havens to liquid assets, as the fears of a new recession become more pronounced every day. This aspect illustrates the aforementioned changing nature of the current market rout.

2. More Pronounced Fear is the First Step to Recovery:
The fundamental landscape on the market has changed sharply in the last few days. Investors and traders now seem less concerned with the economic uncertainty that is caused by the coronavirus, and instead, appear to be bracing for an actual recession. In other words, they are acting as if a recession is no longer a matter of "if", but rather of "how severe it is going to be".
They are no longer weighing on whether a major economic contraction is going to be prompted by the COVID-19 pandemic. Investors and traders are instead already taking the next step in preparing for one as if it is a sure thing. This means that investors’ concerns have now become more pronounced, which is why their attitudes towards gold and other havens are now changing.
Investors and traders are dumping gold en masse out of fears that the metal is not going to be a convertible asset during an economic contraction. They fear that if the current economic fallout triggers a new debt bubble burst, akin to the one of the 2008 credit crunch, they would be stuck with gold, which characteristically is an illiquid asset. In other words, the demand for gold is high prior to an economic crash. After the effect, this is no longer the case. This, of course, does not mean that we are already in a recession; rather, it means that the majority of investors and traders are behaving as if we are.
At present, the demand for safe-havens has been transferred over to highly-liquid assets, such as the US dollar. The greenback is the most convertible currency in the world, which makes it an ideal asset for foreign investors, who can quickly benefit from the liquidity of the foreign exchange.
Overall, the selloff of gold is likely to persist for as long as investors and traders continue to fear the prospects of a new recession. Governments and central banks globally have recently started loosening up their monetary policies and increasing government spending, which is intended to curtail the stock market rout and negate the risks to growth. Once the evidence pointing to the efficiency of these strategies start pouring in, tensions would likely subside. Subsequently, the demand for liquid assets is likely to wane, which, in turn, would stop the selloff of havens such as gold.
3. Short Term Outlook:
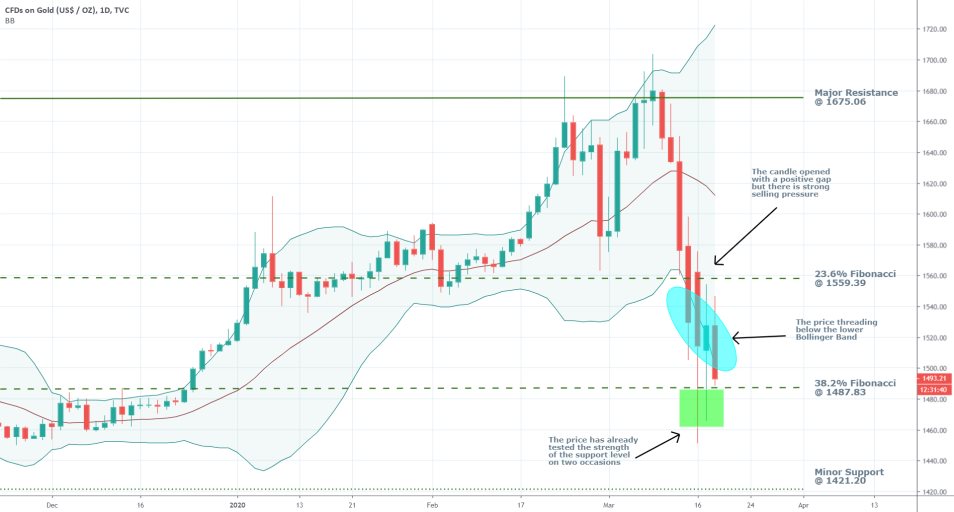
As can be seen on the daily chart below, the widening of the Bollinger Bands has begun only after the recent selloff commenced. This illustrates the intrinsic difference between the two aforementioned stages of investors’ attitudes towards gold.
Comparatively tight BB during an ascend are illustrative of persistent commitment in the market – investors and traders seeking to hedge against the risk from the COVID-19 uncertainty. The sharp widening of the Bands is demonstrative of the sudden appearance of adverse volatility in the market, which is characteristics of investors sudden flee from havens to liquid assets.

On the 16th of March, the underlying price opened with a big positive gap, which extended to the 23.6 per cent Fibonacci retracement but failed to break out above it. This behaviour is manifesting the existence of strong selling pressure just above set level, which is triggered by the execution of multiple short orders there. That is why a rebound back above 1559.39 at present seems highly unlikely.
For the most part, the price action has been threading below the lower Bollinger Band over the past four days, which is yet another major indication that the selling pressure is quite considerable and likely to persist in the near-term. The two lower shadows, which have penetrated below the 38.2 per cent Fibonacci over the last two days, are an indication that the price is testing the strength of that level as a support. They are also the initial steps before the price action attempts to form a new breakdown.

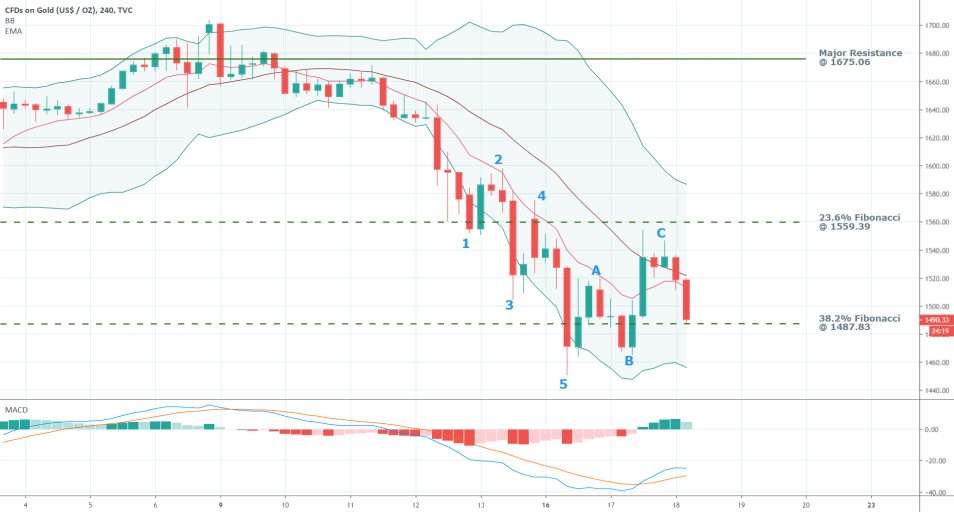
An examination of the 4H chart above, reveals that the selloff is momentarily halted for the time being before the bearish momentum returns to the market. The MACD highlights the temporary prevalence of bullish momentum in the short-term; however, the price is evidently failing to break out above the middle Bollinger Band and the 10-day EMA. This behaviour underscores the accumulation of bearish sentiment in the market before the price of gold continues going south.
The selloff itself is represented on the chart by a classic 1-5 impulse wave pattern, which is postulated by Elliott Wave Theory. It follows that the aforementioned break in the selloff is actually a minor ABC correction, which for the time being fails to drive the bullish correction further north. Hence, the price action appears to be forming a new peak in this temporary pullback, before the development of the major downtrend is renewed.
4. Concluding Remarks:
All underlying evidence seems to be pointing towards the likely continuation of the recent selloff. The price of gold is likely to continue going south in the foreseeable future as more and more investors flee to more liquid assets.
However, traders should be cautious. In this seemingly ever-changing environment, a new and unpredictable development may arise, which could just as easily reinvigorate the previous demand for safe-havens. Thereby, the execution of any short orders should be done with extreme care.

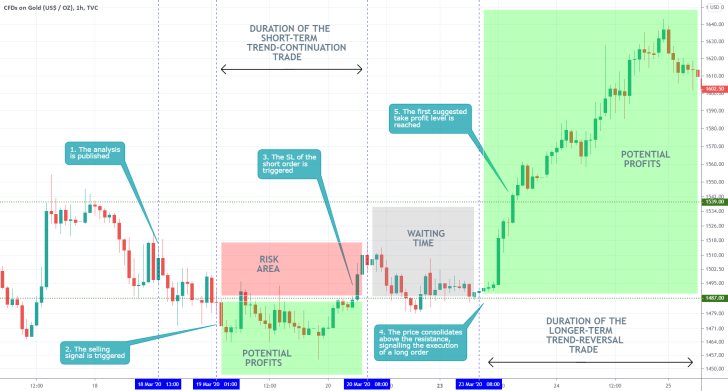
- The analysis suggested two inherently different approaches to trading – a short-term trade that was intended to catch the last trend-continuation opportunity, and a longer-term trend-reversal trade that aimed to catch the subsequent rebound. The analysis quite correctly highlighted the more pronounced bearish bias at the time of publication; however, it overestimated its ability to drive the price of gold further south.
- At times when the market starts establishing a new trend (not a minor correction), traders are better-off to use floating stop-losses and take-profits because it is harder to tell just how far the new trend could go. In contrast, trading on corrections and retracements is arguably easier, because they are frequently terminated around prominent levels of support and resistance, which makes projecting their size beforehand comparatively easier.
Disclaimer: Your capital is at risk! Trading and investing on the financial markets carries a significant risk of loss. Each material, shown on this website, is provided for educational purposes only. A perfect, 100% accurate method of analysis does not exist. If you make a decision to trade or invest, based on the information from this website, you will be doing it at your own risk. Under no circumstances is Trendsharks responsible for any capital losses or damages you might suffer, while using the company’s products and services. For more information read our Terms & Conditions and Risk Disclaimer.


