The tech sector in the U.S. retreats while the dollar advances. The contributing factors are many, but several key developments warrant closer inspection. Firstly, global demand is currently falling, which is evident in the energy market and in the price of crude oil. Secondly, investors' sentiment was shaken recently owing to the vaccine-rollout tribulations and the adamantly dovish stance of the FED on inflation.
The last two developments have caused a resurgence in demand for lower-risk securities, which, in turn, is hurting stocks. That is why the Nasdaq Composite is likely to continue depreciating in the near future, while investors' appeal for the greenback appreciates.
This process is likely to become even more pronounced this week owing to the several testimonies of FED Chair Jerome Powell, one of which is scheduled to take place later today. Moreover, the expectations for weaker durable goods orders in February are likely to exert additional pressure on industry stocks, potentially affecting the tech sector as well.
All of these contributing factors are likely to exacerbate the short-term woes for the Nasdaq, which is already showing signs of a potential bearish reversal.
1. Long-Term Outlook:
As can be seen on the daily chart below, the Nasdaq Composite is indeed beginning to establish a new downtrend, at least at first glance. This downtrend is represented as a descending channel, whose upper and lower boundaries have already been tested on two separate occasions each. This behaviour entails a potential dropdown towards the lower edge of the channel for the third time. That is unless the price action manages to break out above the upper limit and head towards the psychologically significant resistance level at 1.40000.
Speaking of the psychological resistance at 1.40000, the false breakout above it (the first test of the channel's upper border) indicates the strong bearish bias that exists there. It favours the likely continuation of the recent downtrend's development. The next swing peak (the second test of the channel's upper border) is lower than the failed test at 1.40000, which represents yet another bearish confirmation.
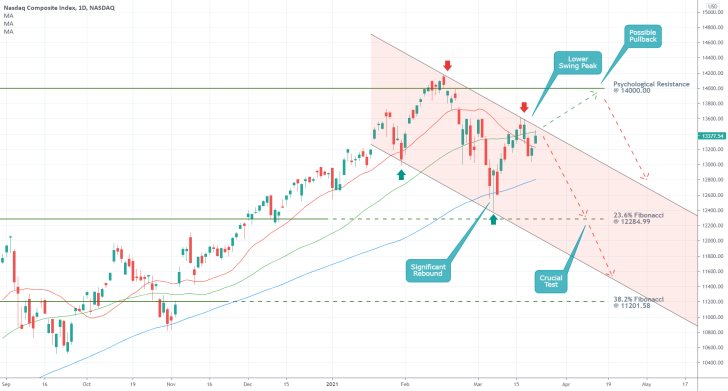
Notice the second bullish rebound from the lower edge of the channel. It represented a Hammer Candlestick, which rebounded not only from the channel but also from the 23.6 per cent Fibonacci retracement level at 12284.99 and the 100-day MA (in blue). This is important for two reasons. Firstly, it confirms the significance of the 100-day MA as a prominent floating support. Secondly, it pinpoints the 23.6 per cent Fibonacci retracement as the next major target for the bearish downtrend.
If the price action manages to break down below it, then the 38.2 per cent Fibonacci at 11201.58 would likely become the next target for the market bears. By that time, the latter would be converging with the channel's lower band, making it an even more prominent target.
Finally, it should also be mentioned that the 20-day MA (in red) recently crossed below the 50-day MA (in green) for the first time since the beginning of the last rally. This represents yet another strong bearish indication.
2. Short-Term Outlook:
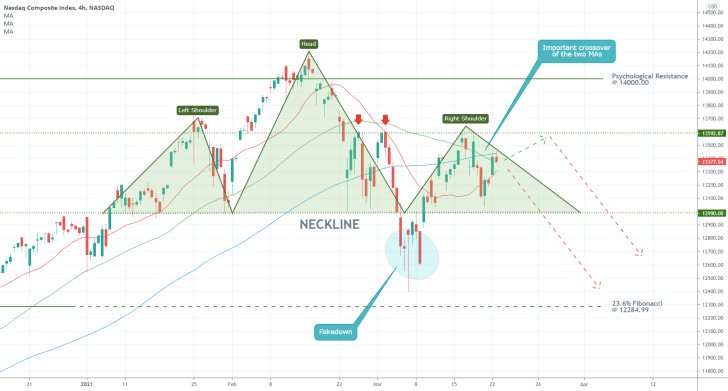
The actual reversal appears to be taking the form of a classic Head and Shoulders Pattern. However, the structure itself is not easy to discern, which underpins heightened volatility. This is inferred from the emergence of a false breakdown below the Neckline (at 12990.00) of the pattern.
Several crucially important conclusions can be derived from the 4H chart below. Firstly, a decisive breakout above the two shoulders (at 13592.00) would signify the bearish opportunity's termination for the time being. This would, in turn, allow for another test of the psychological resistance at 1.40000.
In contrast, a decisive breakdown below the Neckline would confirm the underlying bearish expectations and potentially clear the way for the establishment of a more substantial dropdown towards the 23.6 per cent Fibonacci retracement. These expectations are also substantiated by the fact that the 50-day MA just crossed below the 100-day MA, which underpins rising bearish momentum in the short-term.
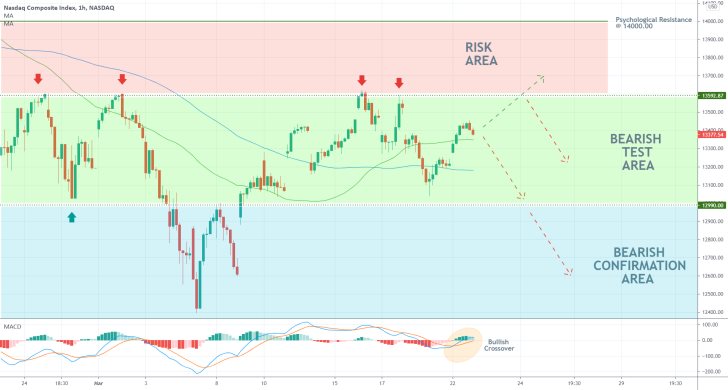
The hourly chart below demonstrates the important areas for bears looking to sell around the current market price, on the expectations for additional dropdowns. As shown, the upper boundary of the Bearish Test Area at 13592.00 (lower border of the Risk Area) has been tested on four occasions recently. That is why bears should not risk placing deep SLs far into the Risk Area.
Less risk-averse traders can do so just above these four swing peaks. In contrast, more risk-averse traders can wait for an opportunity to sell either on the condition that the price action rebounds from 1.40000 yet again or after the price enters into the Bearish Confirmation Area.
The recent uptick in short-term bullish momentum, as illustrated by the MACD indicator, should not be overlooked. It means that the price action might attempt to break into the Risk Area one more time before the broader downtrend is resumed. This is something that market bears should also take into account in their entry considerations.
3. Concluding Remarks:
The Nasdaq Composite looks poised to continue depreciating in the foreseeable future; however, this should not be taken as a certainty. As stated earlier, a decisive breakout above the two Shoulders would manifest a likely termination of the underlying selling opportunity.
Market bears should take all of this into careful consideration and position themselves according to the aforementioned risks of adverse fluctuations.
The Nasdaq Continues to Fall in an Elliott Wave
Bearish pressure continues to mount on the Nasdaq Composite index as rising prices in the U.S. exacerbate fears of inflation getting out of hand. While investors are concerned with rising yields in the bonds market, consumers and business are worried about the increasingly higher costs in the economy.
The preceding bullish rally on the Nasdaq was pummelled last week, as the tech sector in the U.S. started to take a beating from the rapidly rising uncertainty. This newly emerging trend is continuing to affect the index, despite the definite signs of robust economic recovery in the U.S. and elsewhere.
Given all of this persisting uncertainty in the stock market, the Nasdaq composite is likely to continue depreciating in the foreseeable future. What is even more important is that the newly forming bearish trend appears to be taking the form of a 1-5 impulse wave pattern, as per the Elliott Wave Theory.
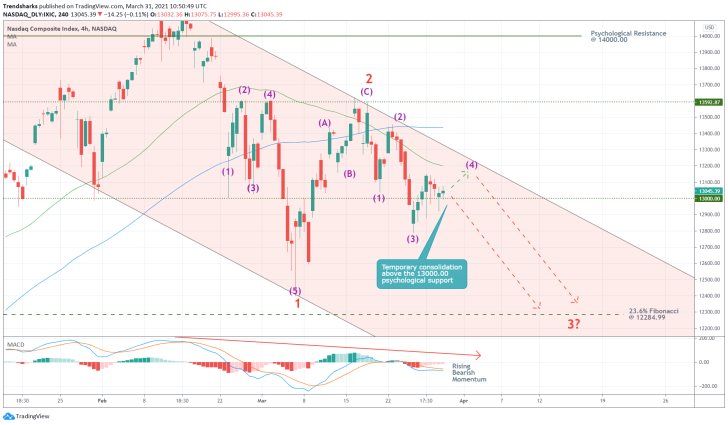
As can be seen on the 4H chart above, the currently emerging downtrend on the IXIC is encapsulated by a major bearish channel. The price action may therefore be tempted to probe its upper boundary one more time before it resumes depreciating.
The underlying bearish sentiment was confirmed following the recent rebound of the price action from the 50-day MA (in green), which currently serves the role of a floating resistance. The preceding crossover of the 50-day MA below the 100-day MA (in blue) also signifies this bearish bias. Seeing as how the two moving averages are currently threading close to the upper boundary of the channel, another rebound of the price from it seems highly plausible.
The boundaries of the channel and the two moving averages play an integral role in determining the highs and lows of the existing Elliott Waves. As shown, the aforementioned rebound from the two MAs and the channel's upper border elucidated the completion of the first retracement leg (1-2) of a major 1-5 pattern (in red). This presupposes the likely establishment of the next impulse leg (2-3) towards the 23.6 per cent Fibonacci retracement level at 12284.99. The fact that each of these impulse and retracement legs comprises minor Elliott patterns further substantiates these expectations.
At present, the price action is consolidating above the psychologically significant support level at 13000.00, which is why a decisive breakdown below the latter would signify the beginning of the 2-3 impulse leg. Bears can therefore wait and see whether the price action tests the upper boundary of the channel one more time before they place their selling orders. They can do so either at the resulting swing peak (at the latest point 4, in purple) or after such a decisive breakdown below 13000.00 takes place.
Finally, the MACD indicator also confirms the steadily rising bearish momentum in the market.
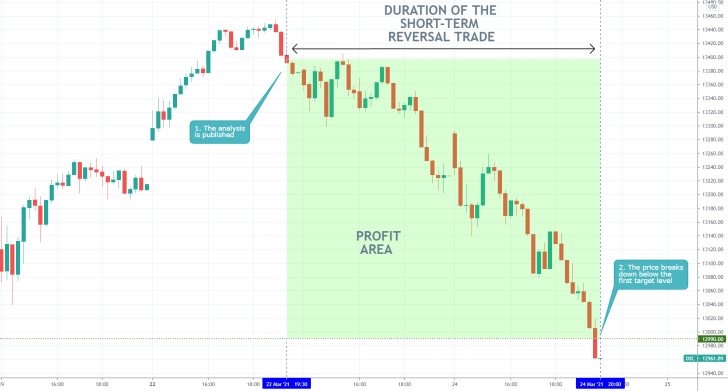
- Another sweeping success. The initial analysis projected the imminent reversal quite accurately, catching 402 basis points so far and counting. The stocks selloff is prompted, in part, by recuperating global activity.
- Now that the first target level has been reached following the completion of the Head and Shoulders pattern (as seen in the analysis), market bears can eye the likely continuation of the dropdown towards the next target - the 23.6 per cent Fibonacci retracement level at 12284.99.
- However, bears should be aware of possible pullbacks. Those could wipe out some of the running profits before the downtrend is resumed. On the other hand, the establishment of a minor swing peak on the top of such a bullish pullback would allow bears to possibly add to their selling positions.
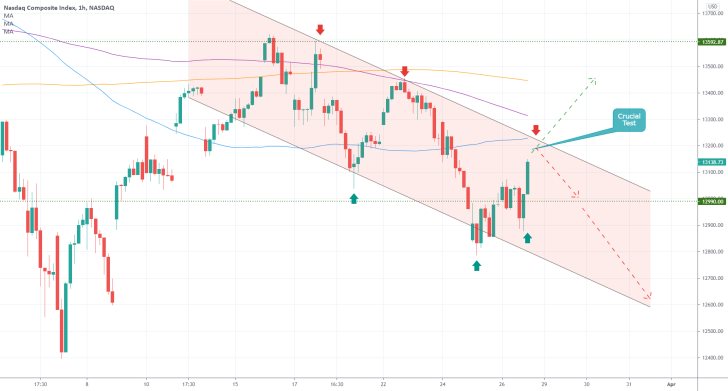
- The Nasdaq Composite is recuperating in the short-term following the beginning of a new downtrend (underpinned by the descending channel). The short-term bullish bias is manifested by the two higher swing-lows (the two green arrows).
- The price action is likely to test the upper boundary of the channel, which is converging with the 100-day MA (in blue) at present, before the downtrend can be resumed. Bears can take advantage of such a rebound from the two by utilising trend-continuation trading strategies. They would be able to sell at the resulting peak.
- Meanwhile, a decisive breakout above the channel's upper boundary would signal the likely termination of the selling opportunity and a potential continuation of the upswing's development further north.
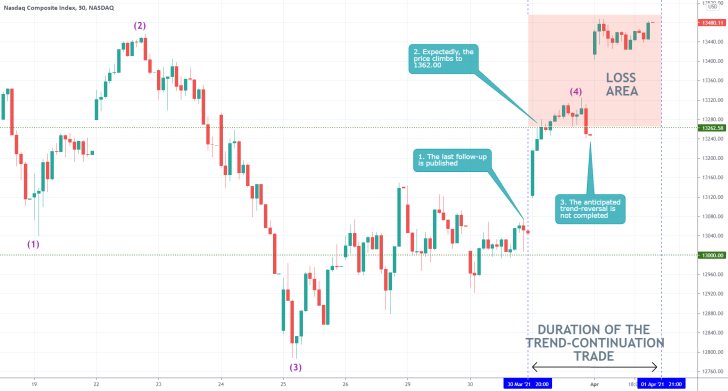
- The expectations of the last follow-up were only partly met. The price action of the Nasdaq Composite did indeed rise to point (4); however, a reversal did not take place. One was anticipated to occur there, allowing bears to utilise trend-continuation strategies. Instead, the price resumed appreciating as stocks rallied.
Disclaimer: Your capital is at risk! Trading and investing on the financial markets carries a significant risk of loss. Each material, shown on this website, is provided for educational purposes only. A perfect, 100% accurate method of analysis does not exist. If you make a decision to trade or invest, based on the information from this website, you will be doing it at your own risk. Under no circumstances is Trendsharks responsible for any capital losses or damages you might suffer, while using the company’s products and services. For more information read our Terms & Conditions and Risk Disclaimer.


