The Nasdaq Composite index has been threading around the psychologically significant resistance level at 14000.00, which represents an all-time record for the index, for a couple of days now, and traders are keen on seeing what happens next. More precisely, they would like to know whether the existing uptrend is strong enough to break out above the resistance, or the time has come for a new correction.
The rally was bolstered recently on robust earnings data from major companies, such as Google's parent company Alphabet Inc. and Apple. The tech giants' solid quarterly performance strengthened the Nasdaq; however, this positive impact is likely to diminish now that the earnings season is over for most of U.S.' biggest companies.
Given the current slow week, the time seems perfect for bears to regain control in the short term before the underlying rally can be extended further north.
1. Long-Term Outlook:
As can be seen on the daily chart below, the price action is indeed currently testing the all-time record at 14000,00. If it manages to successfully break out above this psychological barrier, the Nasdaq will then continue climbing into uncharted territory. However, if the bears manage to jolt the direction of the price action now, a correction could potentially reach either the major support at 13500.00 or even the psychological support at 13000.00.
It is worth examining the behaviour of the price action around the latter because it could reveal how the Nasdaq is likely to behave around the current resistance. As underpinned by the red and green arrows, the price action initially failed to break out above 13000.00 when it first reached this resistance. The eventual breakout was then followed by a couple of throwbacks to the now-support at 13000.00. This behaviour substantiates the expectations for the emergence of a minor bearish correction from 14000.00.
Notice that the Bollinger Bands are currently diverging away from each other, which implies rising volatility at the present moment. This is normal given the bullish rebound from the last bearish pullback. The BB indicator's middle line is currently converging towards the 13500.00 support, which is why this level is being viewed as the first most likely dip of a forthcoming correction. Meanwhile, the lower band of the indicator is converging towards the psychological support at 13000.00, which makes the latter the next most likely target level for a potential bearish correction.
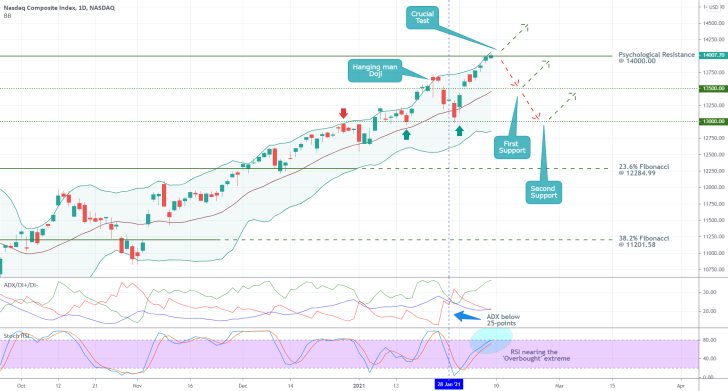
The ADX indicator has been threading below the 25-point benchmark since the 28th of January, which means that the market is technically range-trading at present. Such sentiment is favourable for the development of corrections. Meanwhile, the Stochastic RSI indicator is currently nearing its 'Overbought' extreme, which could prompt more selling pressure around the current market price.
Notice also that the last bearish correction was initiated after the emergence of a Hanging Man candlestick. If another such candle entailing possible bearish reversal is formed near the current market price, this will represent a very solid confirmation of the expectations for another correction.
2. Short-Term Outlook:
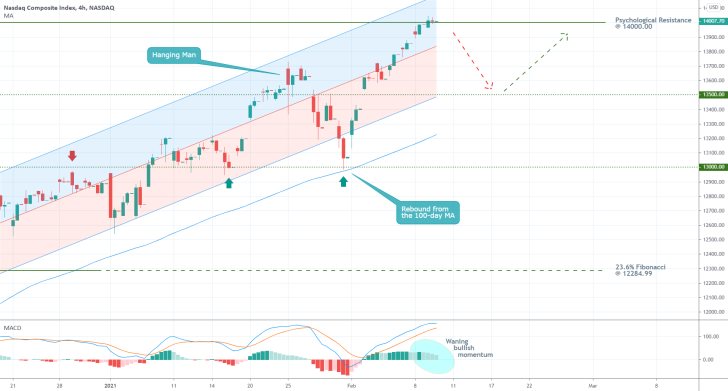
As shown on the 4H chart below, the last upswing is represented using a regression channel. At present, the price action is contained within the upper portion of the channel; however, a breakdown below its middle line would allow for a more sizable dropdown to occur. The lower edge of the channel is currently converging towards the 13500.00 support, which substantiates its role as a potential target level for another bearish correction.
Moreover, traders are advised to monitor the subsequent progression of the 100-day MA (in blue), which serves the role of a floating support. Seeing as how the last bearish correction bottomed out just above the moving average, the same scenario is likely to unfold the next time around.
The MACD indicator continues to underscore robust bullish momentum in the market at present; however, its strength is currently depreciating. This can be inferred from the indicator's histogram. This behaviour could be an early signal of a forthcoming correction, which is inlined with the analysis's primary expectations.
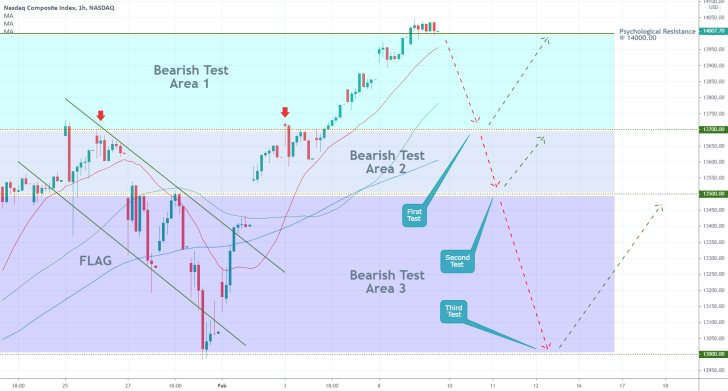
Unless the price action immediately resumes rising after today's open, there are three likely levels to which a potential bearish correction could drop to. Those include the 13700.00 support, which serves as the lower boundary of Bearish Test Area 1 (as shown on the hourly chart below); Bearish Test Area 2's lower limit at 13500.00; and Bearish Test Area 3's psychologically significant lower limit at 13000.00
3. Concluding Remarks:
As regards the available opportunities for market bears, it should be mentioned that contrarian trading in an established trend entails a high degree of risk. Hence, those are not suitable for highly risk-averse traders. If, however, they do decide to take advantage of a potential correction by using trend-reversal strategies, a retracement below 14000.00 would represent the first necessary cue. As seen on the hourly chart above, each of the three aforementioned levels represents a potential target for such a correction.
As regards the available opportunities for market bulls, those who do not already have any open positions are better off waiting for the completion of a bearish correction before they join the market. In other words, they could look for an opportunity to buy into the market at a potential dip around one of the three supports.
The Nasdaq is in the Process of Developing a Head and Shoulders Pattern
U.S. tech stocks became somewhat sidelined by the cryptocurrency hype over the last several days, as traders continue to pay close attention to the situation with Bitcoin. The Nasdaq Composite already fell by more than 3 per cent from the last swing high, and the index continues to look pressured. That is why bears eye a potential continuation of its price depreciation.
Part of the reason for the downturn stems from the recently observed pick up in treasury yields. The U.S. 10-year Treasury note's yield surged past 1.4 per cent, which is the highest level on record since February 2020. Rising yields are likely to affect investors' preferences in the short-term. Namely, investors' heightened demand for bonds and other low-risk securities, such as gold, is likely to correspondingly stymie demand for assets entailing a higher degree of risk, like stocks and cryptos.
In other words, traders and investors' demand for the Nasdaq, which until recently was fueled by FED's massively accommodative monetary policy stance is likely to subside in the near future, potentially leading to continued price depreciation. Several crucial test levels would have to be broken by the index' price action before these bearish expectations can be confirmed.
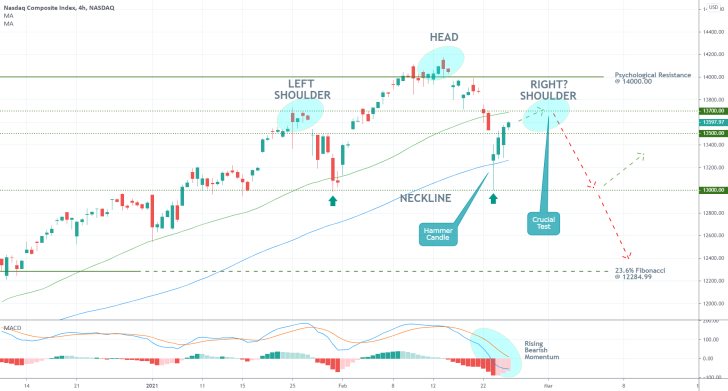
As can be seen on the 4H chart above, the Nasdaq appears to be in the process of establishing a Head and Shoulders Pattern, which is typically taken to represent a likely termination of an existing uptrend and a subsequent bearish reversal. This behaviour of the price action, at least for the time being, is inlined with the aforementioned expectations for diminished investors' demand for high-risk assets.
Notice that the Hammer Candle (the beginning of the Right Shoulder) rebounded from the psychologically significant support at 13000.00, which serves the role of a Neckline for the H&S Pattern. Moreover, the candle's body closed above the 100-day MA (in blue). Both of these factors underpin the strength of the currently developing bullish pullback. However, this pullback is about to have its first crucial test - the resistance at 13700.00.
The latter highlights the swing high of the Left Shoulder, and it is also currently converging with the 50-day MA (in green), which acts as a floating resistance. It follows that, unless the price action manages to break out above 13700.00 decidedly, a bearish rebound from it would mean a very probable completion of the H&S Pattern. This is something that can be exploited by the bears.
Provided that such a bearish rebound from 13700.00 does indeed occur next, the bears could trade on the expectations for another dropdown to the Pattern's Neckline at 13000.00. If the price action breaks down below this second test level, it would then be able to potentially dive towards the next psychological support - the 23.6 per cent Fibonacci retracement at 12284.99.
The falling MACD indicator signifies this ostensibly bearish market momentum that is prevailing at present.
Nasdaq Bears with Another Chance to Target the 23.6% Fibonacci
The Nasdaq Composite recently broke out above the psychological 13000.00 resistance, which serves the role of a Neckline for a major Head and Shoulders Pattern. Market bulls interpreted this as an indication that the index would stop diving and that there is still a chance for continued price appreciation. Nevertheless, the bearish opportunity is not yet entirely invalidated.
This bearish sentiment gripped the tech sector as investors started weighing in on the possibility of the FED adopting a more hawkish policy stance in the wake of rising U.S. yields. Growing inflation and recuperating labour market, the concerns go, will compel the FED to recalibrate its monetary support, which would consequently diminish the support for investors. In a sense, the stock market rally is hugely dependent on FED support, which, in turn, is subject to the underlying economic conditions. As the pace of recovery accelerates, so the need for FED support wanes.
The FOMC maintains that it will carry on supporting the still tentative recovery for the time being by keeping the loose monetary policy at least until the end of 2022. Nevertheless, the secondary market has already started to revise its general outlook on the situation. That is why the underlying bearish sentiment on the Nasdaq Composite is only likely to grow in the near future.
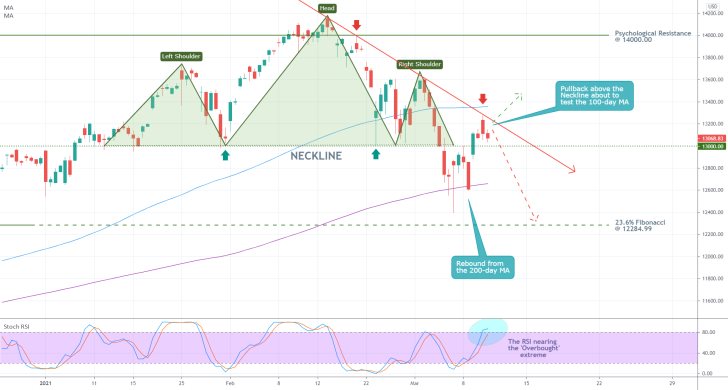
As can be seen on the 4H chart above, the price action rebounded from the 200-day MA (in purple) recently before retracing back above the H&S' Neckline at 13000.00. It is currently consolidating within a very narrow range, spanning between the psychological support, the 100-day MA (in blue), and the descending trend line (in red). This creates a bottleneck around the current market price, and the next decisive breakout (in either direction) will signify the following most likely direction for the index.
In other words, a decisive breakout above the trend line and the 100-day MA would substantiate the hopes of the bulls and underpin the likely termination of the selling opportunity. In contrast, a decisive breakdown below 13000.00 would demonstrate that the market is ready to fall once more.
The 200-day MA continues to serve the role of a floating support, which is why the moving average still represents a major obstacle for the bears. Meanwhile, their next target level continues to be the 23.6 per cent Fibonacci retracement level at 12284.99.
It is also worth mentioning the fact that the Stochastic RSI indicator is nearing its 'Overbought' extreme, which could be a likely precursor to a subsequent bearish reversal.
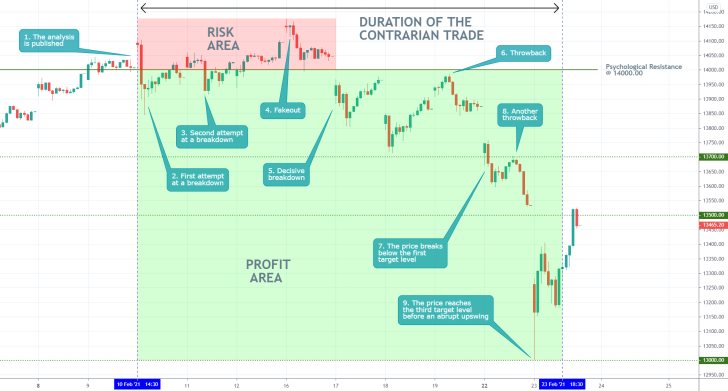
- The forecasts of the analysis were fully realised as the Nasdaq Composite completed a trend reversal. An almost perfect execution of a contrarian trade.
- Notice that the price action just touched the psychologically significant support at 13000.00 (the third target level) before rebounding back up. The biggest takeaway here is that volatile assets tend to behave so near important supports and resistances. Traders need to keep in mind the possibility of such abrupt fluctuations when they set their TPs and SLs.
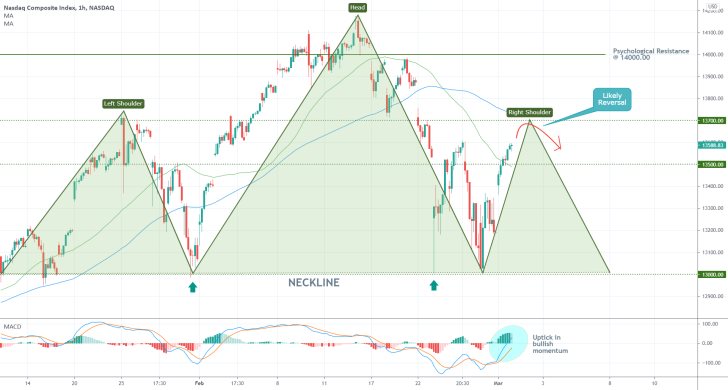
- The price action is behaving as per the expectations of the last follow-up, currently nearing the resistance at 13700.00. This is where the bullish pullback, exemplified by the MACD's rising momentum, is likely to reach a peak, thereby establishing the Right Shoulder of the broader Head and Shoulders pattern.
- Notice that the 100-day MA (in blue) is currently converging with the 13700.00 resistance, which is making the latter an even more probable turning point for the direction of the Nasdaq Composite's price action.
- Provided that the price action does not break out above 13700.00 decisively, this is where bears can start looking for an opportunity to go short; on the expectations for a renewed downtrend towards the H&S' Neckline at 13000.00. It is very likely for the price action to test breaking below this psychologically significant support level.
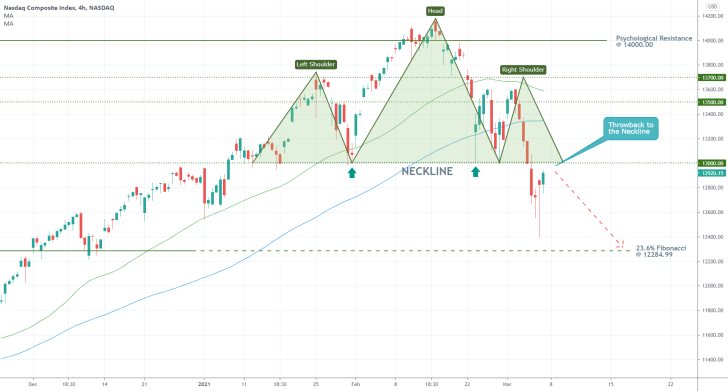
- The Nasdaq Comp. expectedly concluded developing a Head and Shoulders pattern, however, it should be noted that the Right Shoulder was established 100 BPs below the expected level (13700.00). The price action successfully broke down below the 100-day MA (in blue) and the pattern's Neckline at the 13000.00 psychological support, demonstrating the strong bearish bias.
- Given the expectations for continued pressure on stocks this week, the index is likely to continue depreciating in the near future.
- The price action is currently developing a throwback to the Neckline (from below), which is unsurprising. Unless it manages to break out above the Neckline decisively, bears can look for an opportunity to add to their selling orders around this crucial test level. The 23.6 per cent Fibonacci retracement level at 12284.99 remains the most likely target for the emerging downtrend.
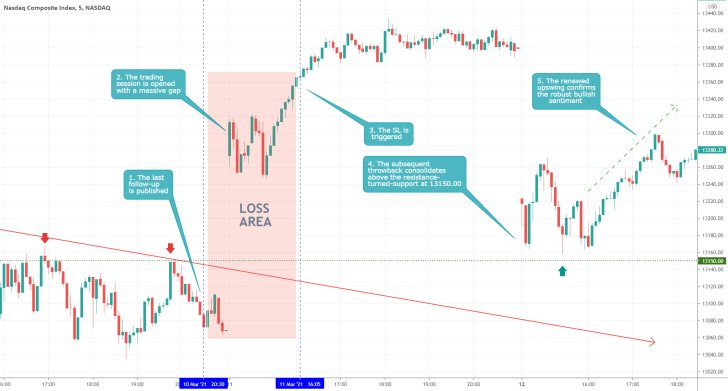
- Shortly after the last follow-up's release, the Nasdaq broke out above the descending trend line (in red) and triggered the SL. The incurred losses from this long-term trade wiped out 2.35% of the nearly 6% running profits that were generated from the short-term trade.
- While the trade's overall performance was successful in terms of profits generated, there are a couple of important conclusions that can be drawn from this setup. Firstly, the change in the underlying market sentiment was brought about by Joe Biden's fiscal policy in the U.S. These external developments were not examined by a follow-up or a journal entry, which was a mistake.
- Secondly, position traders, in particular, should always be on the lookout for potential changes in the underlying market bias owing to new economic developments. Such changes can come from everywhere and could take a number of different forms, which is why traders should not get accustomed to the idea that once they have gotten a favourable entry, nothing can impede their positions.
Disclaimer: Your capital is at risk! Trading and investing on the financial markets carries a significant risk of loss. Each material, shown on this website, is provided for educational purposes only. A perfect, 100% accurate method of analysis does not exist. If you make a decision to trade or invest, based on the information from this website, you will be doing it at your own risk. Under no circumstances is Trendsharks responsible for any capital losses or damages you might suffer, while using the company’s products and services. For more information read our Terms & Conditions and Risk Disclaimer.


