The price of gold has skyrocketed over the last several months, as a direct consequence of the bolstered demand for the precious metal. Gold was already finding itself in a bullish market prior to the global outbreak of the novel coronavirus, as we pointed out in our previous analysis on the commodity, and the escalation of the situation only bolstered the prevailing bullish sentiment in the market.
That is so because gold, alongside the Japanese yen and the US dollar, is one of the most well-known safe-haven assets, which investors flee to at times of crisis and general uncertainty in the global capital markets. On average, the price of gold has appreciated by more than 100 dollars per troy ounce since mid-March, which underpinned the impact of the economic fallout from the healthcare crisis.
The strength of the underlying bullish trend has toned down since then. The price action is currently forming a significant consolidation range, which could end up being the preceding trend's termination point. In our previous analysis of gold, we questioned whether the bullish market could shoot up above the 1800 price level, which was postulated by many market experts in Late-April as being very probable, and now the recent behaviour of its price action seems to have justified our scepticism at that time.
The formation of a major consolidation range appears to be signifying the likely transition of the underlying market sentiment from being ostensibly bullish to now becoming less pronounced. Many markets are now starting to recover from the initial shock brought about at the outset of the pandemic. Consequently, a lot of assets exhibit the same characteristics – the transition from trending to range-trading environments. Our analysis on the NZDUSD being the most recent such example that we have covered.
Thereby, the purpose of today's analysis is to examine the behaviour of gold's price action. Additionally, the material sets out to discern whether or not the price of the precious commodity would tumble following the termination of the range, or the market would resume heading north.
1. Long Term Outlook:
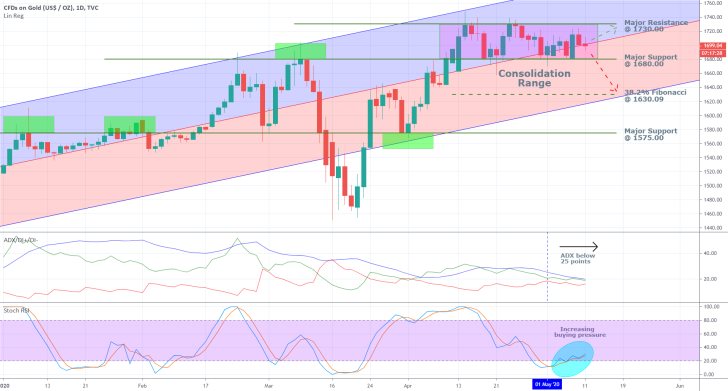
As can be seen on the daily chart below, the price action is contained within the boundaries of a narrow consolidation range. The range's upper edge is represented by the major resistance level at 1730.00, whereas the range's lower limit is underscored by the major support level at 1680.00.

The ADX is threading below 25 points, which confirms the range-trading behaviour of the market. While this condition is preserved, the underlying price action can be expected to bounce up and down within the range's outer boundaries, which benefits the utilisation of swing trading strategies.
The Stochastic RSI has recently fallen to the 'Oversold' extreme, and now the index appears to be gaining new momentum. This behaviour underlines the gradually increasing buying pressure in the market, which, in turn, is likely to drive the underlying price action higher. It is, however, still unclear as to whether this newly found bullish commitment in the market would be sufficient to drive the price action above the range's upper boundary.
Moreover, gold's current market price is trading just around the ascending channel's middle line, which itself can serve either as a support or resistance level. In this particular situation, the line is acting as an intermediate support level. Hence, if the price action manages to bounce up from it, this would confirm the previous assertion regarding its next most likely target – the resistance level at 1730.00.
Conversely, if the price action manages to break down below the channel's middle line, the next most likely target would naturally be the major support level at 1680.00. Subsequently, if the price action does indeed break down below the range's lower edge, the newly developing Markdown would then have to test the significance of the next crucial support level – the 38.2 per cent Fibonacci retracement level at 1630.09. Notice that the latter coincides with the ascending channel's lower boundary, which further bolsters the significance of this support level.
2. Short Term Outlook:

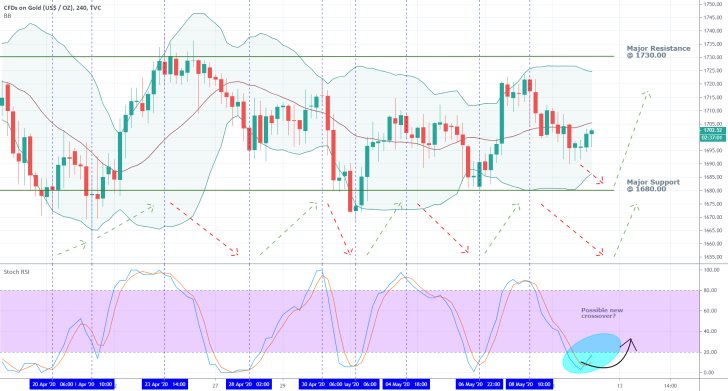
The formation of swing lows and swing highs that is to be expected to occur within the boundaries of a consolidation range is even more clearly visible on the 4H chart above. Each time the Stochastic RSI has entered into one of its two extremes, and there has also been a major crossover, the underlying direction of the price action has been changed just as it has neared one of the range's two boundaries.
Based on this observation, a new projection regarding the most likely future behaviour of the price action can be drawn. Seeing as how the RSI currently finds itself in the 'Oversold' extreme, this is likely to trigger the execution of a new wave of buying orders. This, in turn, is likely to propel the price action towards the direction of the major resistance level at 1730.00 once again. Before this takes place, however, the price action could fall to the major support level at 1680.00 before it finds the necessary bullish conviction.
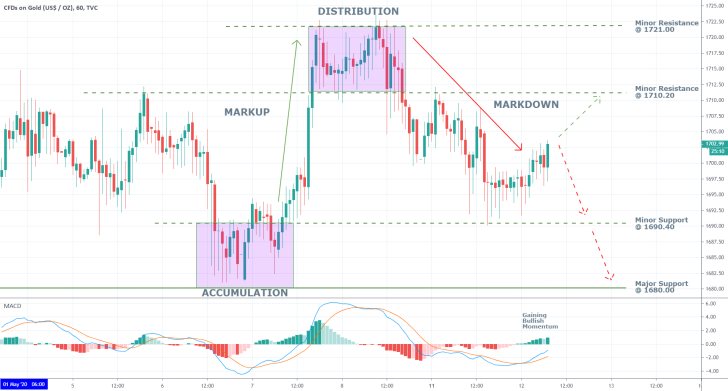
The 1H chart below breaks down the behaviour of the price action into several distinctive stages. As can be seen, it is currently in the process of establishing a new Markdown. The first major target level for this newly evolving Markdown would be the minor support level at 1690.40, which has served as an upper boundary for the preceding Accumulation range. The aforementioned major support level at 1680.00 was its lower boundary, which makes it the second objective for the Markdown.
However, the MACD indicator is currently demonstrating the increasing bullish momentum in the short run, which could impede the subsequent development of the Markdown, and even terminate it. If this were to happen, then the next logical target for the price action would be the minor resistance level at 1710.20.

3. Concluding Remarks:
Gold's bullish trend is now technically concluded, judging by the ADX on the daily chart above. This, in turn, is welcoming news for swing traders who can apply range-trading strategies. These entail the execution of short orders once the price action nears the upper limit of the underlying range, and long orders once it approaches its lower limit.
At present, the price action finds itself in the middle of the range, which means that swing traders would have to wait and see where it goes next before they execute any swing trades.

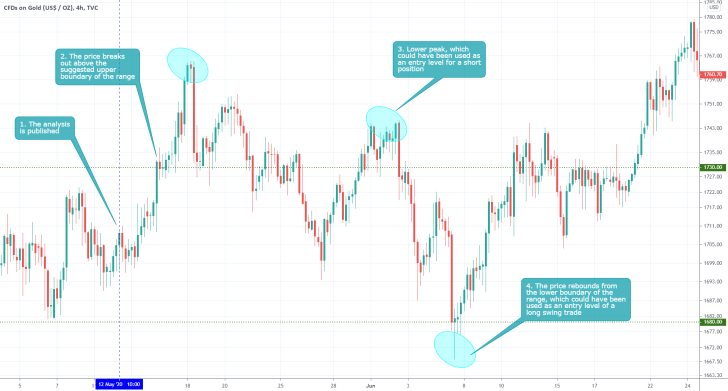
The expectations of the analysis for the formation of a new range in the mid-term were realised, however, the upper boundary of set range was mistaken. The price action broke above the 1730.00 resistance on several occasions before falling to the support at 1680.00. Traders need to be careful when plotting their support and resistance levels.
Disclaimer: Your capital is at risk! Trading and investing on the financial markets carries a significant risk of loss. Each material, shown on this website, is provided for educational purposes only. A perfect, 100% accurate method of analysis does not exist. If you make a decision to trade or invest, based on the information from this website, you will be doing it at your own risk. Under no circumstances is Trendsharks responsible for any capital losses or damages you might suffer, while using the company’s products and services. For more information read our Terms & Conditions and Risk Disclaimer.


