Following the release of Bank of Japan's monetary policy statement from earlier today, the demand for the Yen started surging due to the admissions of Governor Kuroda and his colleagues.
Overall, the undertones of BOJ's statement signalled the likelihood of a protracted recovery for the Japanese economy. Additionally, the statement was intended to stress on the unpredictable nature of the coronavirus crisis, which continues to threaten the stabilisation process.
While the Yen is likely to continue advancing in the near future, as investors and traders weigh in on the prospects of a second (and possibly more severe) coronavirus wave, the situation is quite different for the Canadian dollar.
Firstly, the expectations for a possible bearish correction on the price of oil could affect the value of the Loonie. That is so because the two have a direct relationship, due to the fact that Canada is one of the biggest producers and exporters of the precious commodity. In other words, when oil tanks, the price of the Canadian dollar falls as well.
Secondly, today's monetary policy meeting of the Bank of Canada is expected to exert even more pressure on the already struggling Loonie. The BOC somewhat surprisingly decided to scale back its asset purchase programs in early June, despite the fact that the uncertainty stemming from the crisis continues to pose a significant threat to the tentative recovery process in Canada.
The BOC has to address the new developments that have transpired in the last month and a half, and possibly adjust its monetary policy stance. All of this is likely to increase the underlying volatility during today's trading session on all currency pairs involving the Loonie.
Hence, the purpose of today's analysis is to discern the likely impact of the two central banks' decisions on the CADJPY and to project the reasonable extent of the dropdown that is anticipated to form on the pair's price action.
1. Long-Term Outlook:
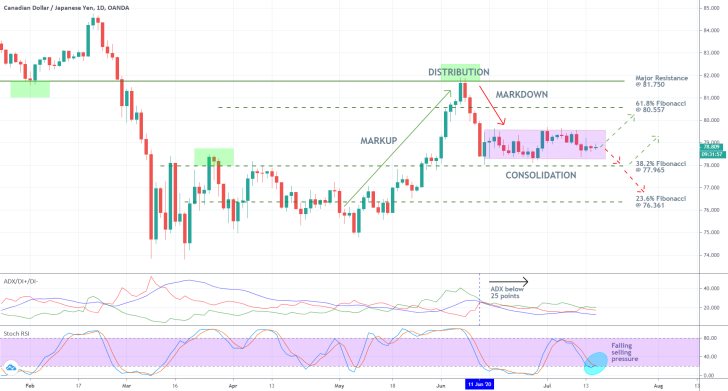
As can be seen on the daily chart below, the underlying price action has been quite subdued over the last several weeks. After having formed a Distribution range between the major resistance level at 81.750 and the 61.8 per cent Fibonacci retracement level at 80.557, the price action developed a new Markdown towards the 38.2 per cent Fibonacci retracement level at 77.965.
Subsequently, the latter morphed into the most recent consolidation range, which is encompassed by the purple rectangle. The longer-term projections of CADJPY's future price action envision the possibility of a dropdown towards the 38.2 per cent Fibonacci retracement (potentially even lower), as the aforementioned fundamentals continue to influence the underlying market pressures. Nevertheless, the possibility of a spike up towards the Distribution's lower boundary should not be disregarded as well.

The ADX has been threading below the 25-point mark since the 11th of June, which confirms the existence of a robust range-trading environment. Under these conditions, the price action is likely to continue bouncing up and down within the boundaries of the consolidation range. It also favours the establishment of a dropdown towards the 38.2 per cent Fibonacci retracement, due to its closeness to the range's lower limit.
Even though the Stochastic RSI indicator is nearing the 'Oversold' extreme and the selling pressure seems to be waning, this does not necessarily mean that a bullish reversal is due next. There is still spare capacity for the bears to continue driving the price action further south, which is inlined with the primary expectations.
2. Short-Term Outlook:
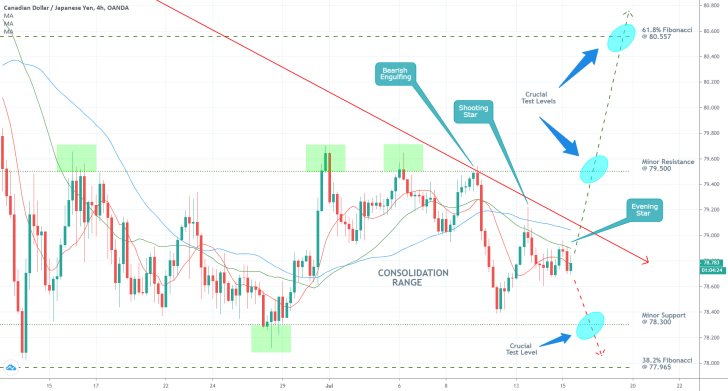
Notice the relationship between the underlying price action and the three moving averages on the 4H chart below. The 10-day MA (in red) is positioned below the 30-day MA (in green), which, in turn, is placed below the 50-day MA (in blue). This descending order illustrates the bearish momentum in the short-term.
Moreover, the expectations for continued depreciation of CADJPY's price action are further supported by the fact that the price action rebounded on the two occasions it tested the strength of the 30-day MA. The first time this led to the creation of a 'Shooting Star' candle, and the second to the emergence of an "Evening Star" candle.

Notice also that the underlying price action remains concentrated below the descending trend line. This confirms the longer-term projections for the development of a more substantial dropdown, which are also supported by the behaviour of the price action in the short run.
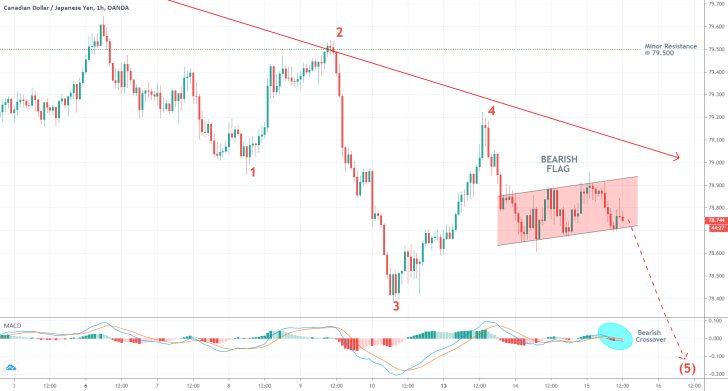
The most recent behaviour of the price action is quite reminiscing of a classic 1-5 impulse wave pattern, which is postulated by the Elliott Wave Theory. As can be seen on the hourly chart below, the last time the price action came close to the descending trend line, was when the peak of the 3-4 retracement leg was concluded. Hence, the broader pattern is likely to be finalised when the price action breaks down below the bottom at point 3 and thereby finishes the establishment of the pattern's final 4-5 impulse leg.
These expectations are further supported by the emergence of a 'Bearish Flag' pattern within the 4-5 impulse leg. The former is typically found during the development of downswings or massive bearish trends.
Finally, the bearish crossover on the MACD is congruent with the anticipations for extended bearish momentum in the near future.

3. Concluding Remarks:
The underlying fundamentals support the expectations for a new dropdown on the CADJPY's price action. Nevertheless, the possibility of a sudden reversal should not be wholly disregarded.
The first major target level for such a newly evolving downswing is encapsulated by the 38.2 per cent Fibonacci retracement level at 77.965.

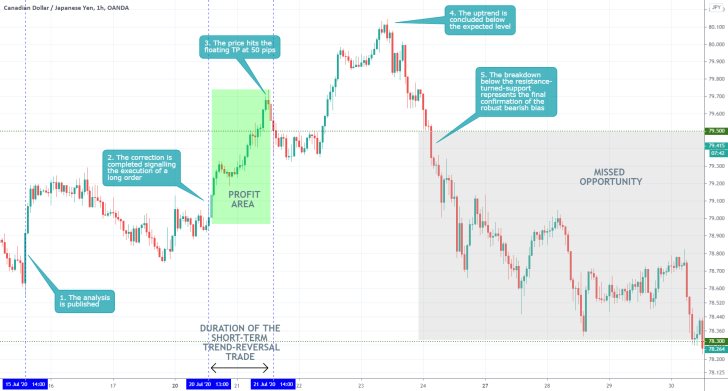
- The analysis misconstrued the expected impact of the heightened demand for the yen, as a safe-haven asset, on the pair. The Canadian dollar, in turn, has a direct correlation with the price of crude oil. When the price of the commodity rises, so does the value of the Loonie. As was established in the previous journal entry, the price of crude oil was rising around the same time, so it made no sense expecting the CADJPY to depreciate.
- The analysis did a good job of pointing out the possibility for the formation of a bullish correction, however, the short-term projections were mostly imprecise. The analysis could have done more in explaining how the underlying trading setup would change if a bullish upswing emerged first before the price got ready to start depreciating.
Disclaimer: Your capital is at risk! Trading and investing on the financial markets carries a significant risk of loss. Each material, shown on this website, is provided for educational purposes only. A perfect, 100% accurate method of analysis does not exist. If you make a decision to trade or invest, based on the information from this website, you will be doing it at your own risk. Under no circumstances is Trendsharks responsible for any capital losses or damages you might suffer, while using the company’s products and services. For more information read our Terms & Conditions and Risk Disclaimer.


