The German DAX reached a new all-time record just below 15500.000, as was forecasted by our last analysis of the German index, and is now in the process of establishing a new bearish correction. The retracement emerged from this all-time peak, as selling pressure keeps mounting up.
The changed sentiment is owing to several contributing factors. Firstly, the massively robust earnings season in the U.S. is shifting investors' focus away from European companies and onto American stocks. Secondly, the widening gap between the growth rate of developed economies and emerging markets is posing a significant threat to global recovery.
Such a gap is thus likely to compel investors to flee to safer assets, which is more likely to favour the greenback against the euro. Consequently, European stocks are left exposed to the risks associated with shifting global sentiments.
Therefore, the recent correction on the DAX is likely to continue digging deeper before the index finds strong support and manages to recuperate. The purpose of this analysis is to examine the possibility of a dropdown to the closest Fibonacci support.
1. Long-Term Outlook:
As can be seen on the daily chart below, the correction is taking the form of a descending channel (Flag). The price action attempted to penetrate below the psychologically significant support level at 15000.000 once, but the snap rebound gives bulls some air of comfort.
Nevertheless, this sudden dropdown encapsulates only the first test of the channel's lower boundary, which is why further dropdowns can be expected in the future. At the same time, the upper band of the Flag has already been confirmed on two separate occasions, thereby substantiating the underlying expectations.
Notice that the first dropdown below 15000.000 rebounded just above the 50-day MA (in green), which acts as a floating support. The subsequent bullish pullback was then concluded just below the 20-day MA (in red), which has since recently started to serve the role of a floating resistance.
The consolidation of the price action within these two moving averages, which are currently threading near the two extremes of the channel, signifies the rising bearish sentiment in the market. It is precisely what is to be expected if the price action is to continue depreciating in the foreseeable future.
The correction itself signifies the termination of the preceding bullish trend, just as the Ascending Wedge had previously elucidated the likely continuation of said trend.
The price action is likely to test the channel's lower boundary on two more occasions before the correction bottoms out. Meanwhile, an intermittent throwback to 15000.000 from below - the third test of the Flag's upper boundary - would potentially allow bears to add to their selling orders.
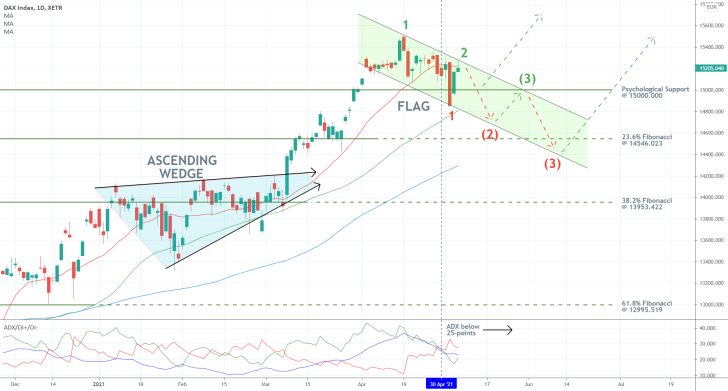
Ultimately, the correction is likely to bottom out near the next psychologically significant support level - the 23.6 per cent Fibonacci retracement level at 14546.023. Its significance stems from the fact that it is positioned almost exactly at the midpoint between the two psychological thresholds - 14000 and 15000.
Moreover, the 23.6 per cent Fibonacci is about to converge with the 100-day MA (in blue), which serves as a floating support, thereby making it an even more significant turning point.
The ADX indicator fell below the 25-point threshold on the 30th of April, which underpins the newly emerging range-trading sentiment in the market. This is to be expected whenever the market is making a correction and thereby supports the primary expectations.
2. Short-Term Outlook:
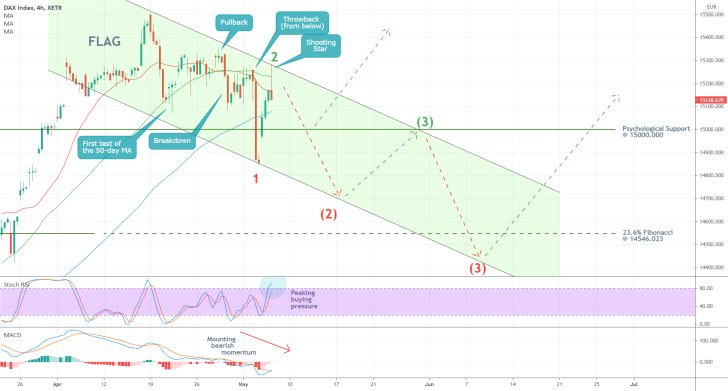
The 4H price chart below delineates the rapidly rising bearish bias in greater detail. This can be observed from the behaviour of the price action near the boundaries of the channel and the three moving averages.
The rising bearish bias is encapsulated by the (test from above - pullback - breakdown - test from below) relationship between the price action and the moving averages. This leads to the emergence of consecutively lower peaks, signifying the shifting market bias.
Notice that at present, the price action is developing a Shooting Star candle, which is a candlestick that is typically taken to represent mounting selling pressure. It is commonly found near fresh swing peaks and allows traders to sell before the price establishes a new dropdown.
The increasing bearish bias can also be inferred from the MACD and the Stochastic RSI indicators. The former underpins mounting bearish bias, whereas the latter signifies waning buying pressure.
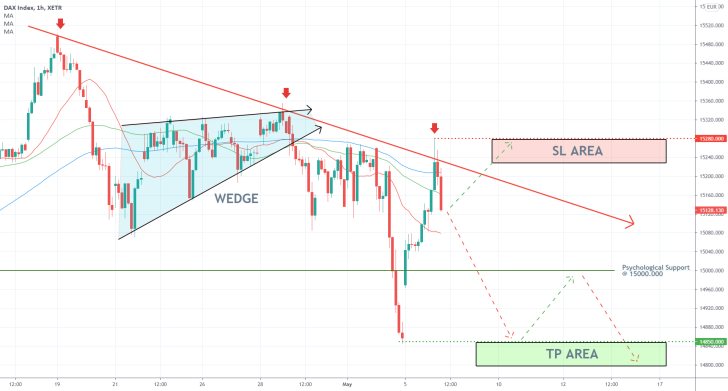
Bears can start looking for an opportunity to sell the DAX immediately. The minor Wedge that emerged recently on the hourly chart below serves as yet another selling signal. Additionally, the retracement from the 100-day MA and the 50-day MA also underpins the readiness of the price action to continue sliding immediately.
A stop-loss order should be placed just above the descending trend line and around the latest swing peak. In other words, such a stop order should be placed close to the minor resistance level at 15280.00.
Accordingly, the first target for the bears is encapsulated by the nearest swing low - the minor support level at 14850.000.
3. Concluding Remarks:
Given that the longer-term expectation is for the DAX to fall to the 23.6 per cent Fibonacci retracement level, bears can take advantage of the opportunity by using flexible entries and exits.
As stated earlier, they can use a potential throwback to the psychological price level at 15000.00 from below as an opportunity to add to their selling orders. Moreover, they can move their stop-losses to 14850.000 once the price action breaks below it in order to cap their running profits and protect their positions against adverse fluctuations.
The DAX Consolidates Above a Psychological Support
The price of the German index is currently strengthening above the psychologically significant support level at 15000.000, which provides bulls with an excellent opportunity to lock in their long orders just above this critical threshold. An anticipated correction below this level was not realised, which confirms the renewed bullish sentiment in the market.
The DAX is consolidating ahead of the release of the crucially important inflation rate data in the U.S., which is poised to shake markets later today. Tech stocks were hit yesterday by mounting investors' fears, and this trend could potentially be exacerbated today.
That is so because fears of rising consumer prices are causing an outflow of capital from stocks towards lower-risk securities. This was also the primary cause of the recent correction on the DAX, but seeing how the price of the index is strengthening above 15000.00, this could be perceived by bulls as a sign of strength.
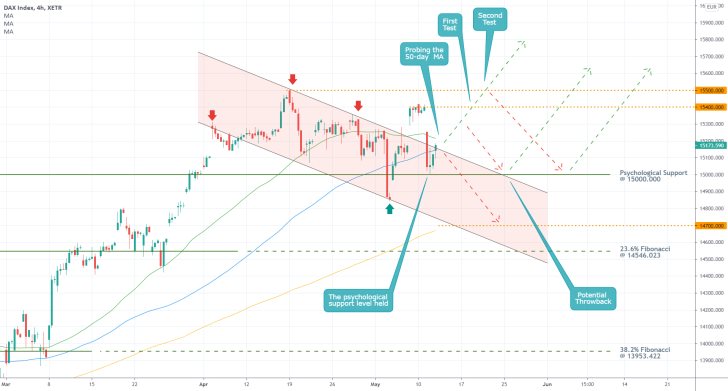
As can be seen on the 4H chart above, this temporary range-trading environment is likely to be followed by a renewed rally. The price action would first have to break out above the 50-day MA (in green) and the 20-day MA (in red) and above the upper boundary of the descending channel. This would be the trigger signal that bulls are waiting for.
The first test for the reinvigorated uptrend can be found at 15400.000. A 100 basis points to the north is where the second crucial test can be found. Should the price action break out above it, too, bulls could then substitute their fixed stop-loss orders with floating stop orders. That is how they can squeeze the maximum out of the subsequent rally into uncharted territory and cap their running profits.
Conversely, a potential reversal from the upper boundary of the channel followed by a breakdown below the psychological support would indicate the invalidation of the bullish opportunity.
A resumed bearish correction could initiate a dropdown towards the lower boundary of the channel. The first support that could be found below 15000.000 is underpinned by the 200-day MA (in orange, currently at 14700.000).
If the latter gets penetrated, then the price action could head towards the next psychologically significant support level - the 23.6 per cent Fibonacci retracement level at 14546.023.
The DAX Is Forming a Bearish Crab Pattern
The German stock index rebounded from the psychologically significant support level at 15000.000 recently and is currently probing the semi-psychological resistance at 15500.000. The bullish momentum was initiated following the publication of the latest inflation rate data in the U.S.
European stocks were affected positively by the rapidly growing consumer prices across the pond, and this trend is likely to be continued this week. German industry numbers are scheduled for publication on Friday, and the expectations are for solid gains in the services sector.
Despite these prevailingly bullish-oriented signals, longer-term sentiment could turn more bearish soon. The beginning of a new supercycle in the commodities market could stymie the demand for stocks, potentially exerting extra selling pressure on the DAX. This could lead to a trend reversal in the near future.
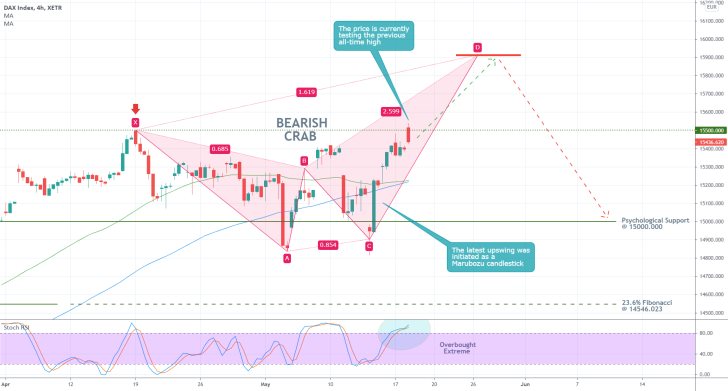
As can be seen on the 4H chart above, the DAX index appears to be forming a Bearish Crab pattern, which typically entails likely bearish reversals. This is strong enough confirmation of the aforementioned bearish sentiment, but there is more.
Provided that the price action reaches point D at around 15900.000, this would create perfect selling conditions. Moreover, the peak of the Crab pattern would be situated close to the psychologically significant resistance level at 16000.000, which in itself serves as a major turning point.
Even though the index is expected to appreciate by an additional 300-400 basis points before such a reversal takes place, bears should keep an eye on the immediate behaviour of the price action.
The Stochastic RSI indicator is already threading in its overbought extreme, which could incite more selling pressure in the near future. Moreover, the price action is currently testing the historic resistance level at 15500.000. Given that the index has never been able to penetrate this threshold decisively in the past, a reversal from the current market price seems highly probable.
On the other hand, the latest upswing was initiated as a Marubozu engulfing candle that rebounded from the psychological support at 15000.000. The latter was also able to break out above the 50-day MA (in green) and the 100-day MA (in blue), both of which were serving as floating resistances at the time. This confirms the strength of the bullish pressure in the short term.
At any rate, bulls should not go long now (if they do not have any open positions), just below the all-time high. However, a breakout above 15500.00 could clear the way for the upswing to rise towards 15900.00. This is where bears should look for an opportunity to sell once the Bearish Crab pattern is completed.
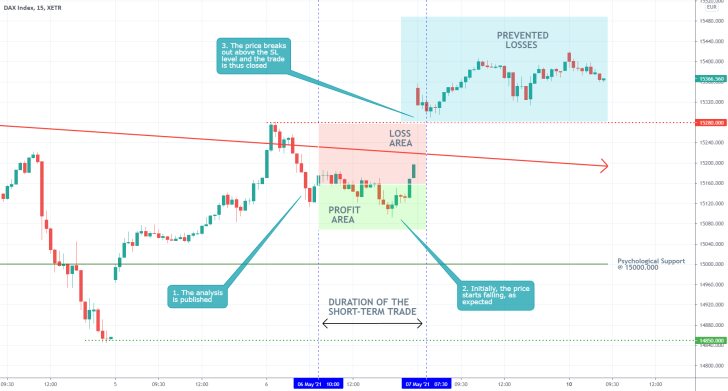
- Even though the analysis incurred some initial losses, it succeeded in more ways than it failed. There was a pretty strong case to be made in justification of such a short trade, so it made sense to sell below the descending trend line.
- The fact that the SL was triggered almost immediately afterwards is more an attestation to the properly applied risk management strategy rather than unjustified trading.
- Ultimately, the SL is meant to serve as a protection against adverse fluctuations, and the latest upswing was just that. In that sense, the SL was structured very well and it averted bigger losses.
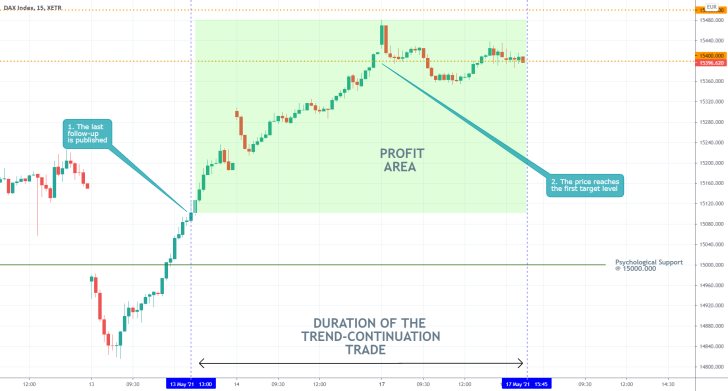
- Our last DAX follow-up turned massively successful. There is not much more that could be said here. Excellent timing and correct forecasting of the direction of the index.
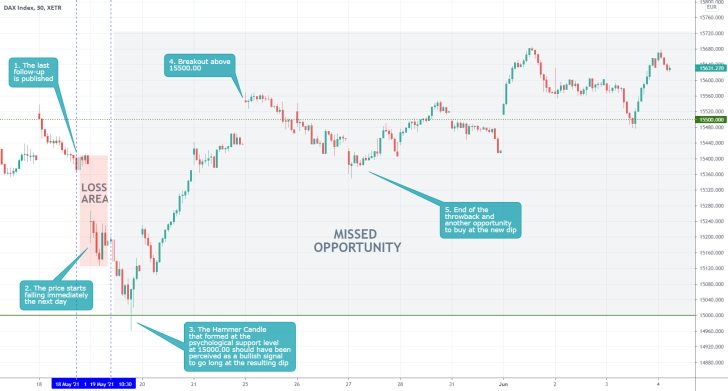
- The last follow-up analysis of the DAX was almost a complete failure. Shortly after its release, the price of the index started falling. The next day's trading session opened with a huge gap, hitting the SL almost instantaneously.
- The constant likelihood for the formation of such gaps is something that should be taken into consideration by all index traders.
- Despite the incurred losses, however, there was another issue with the analysis.
- It failed to consider the formation of a Hammer Candle, which is typically taken to signify mounting bullish bias, at the psychologically significant support level at 15000.00. This should have been perceived as a very strong bullish signal.
- Arguably, the biggest shortfall of the entire analysis was the missed opportunity to suggest the execution of a new long order at the resulting dip.
Disclaimer: Your capital is at risk! Trading and investing on the financial markets carries a significant risk of loss. Each material, shown on this website, is provided for educational purposes only. A perfect, 100% accurate method of analysis does not exist. If you make a decision to trade or invest, based on the information from this website, you will be doing it at your own risk. Under no circumstances is Trendsharks responsible for any capital losses or damages you might suffer, while using the company’s products and services. For more information read our Terms & Conditions and Risk Disclaimer.


