European stocks continue with their steady advance as many countries within the Eurozone ease their containment restrictions. The rally is further supported by the underlying trends in the global stock market.
US tech stocks are continuously rising as investors bet on the robustness of the ongoing economic recovery. A positive spillover effect is being felt in the Eurozone, and major European stocks are also steadily rising as a consequence.
The German DAX index, which comprises the blue chip stocks of the EU's biggest economy, has advanced quite substantially since the market rout in late-March, and since our last analysis of the index.
Presently, the index is consolidating just below the psychologically important resistance level at 13000.00. Subdued price action just below such a significant price level indicates preparation in the market for a test of the level's strength.
In other words, the underlying fundamentals are likely to prompt heightened trading activity in the following days, which, in turn, is going to bolster the market volatility, and propel the DAX towards the aforementioned resistance level. Depending on the strength of the bullish commitment in the market, a significant breakout above set level is quite possible.
That is why today's analysis is dedicated to examining the behaviour of this short-term consolidation range that is forming just below the resistance.
1. Long-Term Outlook:
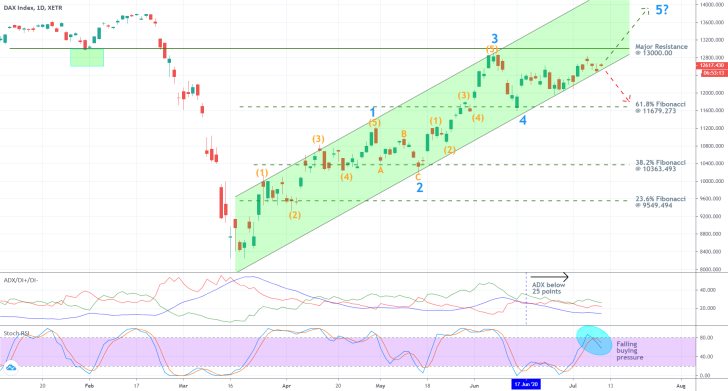
As can be seen on the daily chart below, the aforementioned bullish run is encompassed within the boundaries of a massive ascending channel. Moreover, the price action is currently threading just above the channel's lower edge, and close to the major resistance level at 13000.00. These two factors are signalling a likely surge in volatility, as the market prepares for a breakout in the immediate future.
The importance of the psychologically significant resistance at 13000.00 is further bolstered by the fact that it had previously served as a prominent support level, as demonstrated by the green rectangle.
In addition to the aforementioned fundamentals, the expectations for a major breakout are further supported by the fact that the bullish run is developing as a classic 1-5 impulse wave pattern, which is postulated by the Elliott Wave Theory.
In other words, the broader 1-5 pattern (in blue) needs to establish an additional 4-5 impulse leg before it can be concluded. The fact that the previous impulse (2-3) reached a peak just below the 13000.00 resistance level supports the expectations of a breakout above set level.
Nevertheless, in case that the underlying fundamental factors were to change suddenly, which would undoubtedly affect the prevailing market sentiment, the bullish trend could then be temporarily suspended. A bearish correction towards the 61.8 per cent Fibonacci retracement level at 11679.273 would then be possible.

The ADX indicator has been threading below the 25-point benchmark since the 17th of June, which is not that surprising given the recent termination of the 3-4 retracement leg. The resulting concentration of the underlying price action within a relatively narrow range is also exhibiting common market behaviour. Overall, the observed conditions are favourable for the emergence of a new breakout.
Notice, however, that the Stochastic RSI reached the 'Overbought' extreme last week, but has subsequently started to depreciate. This behaviour indicates rising selling pressure in the short-term, which could potentially impede the further development of the bullish trend. Alternatively, this behaviour could also be interpreted as a momentary break before the buying pressure can start rising once again.
2. Short-Term Outlook:
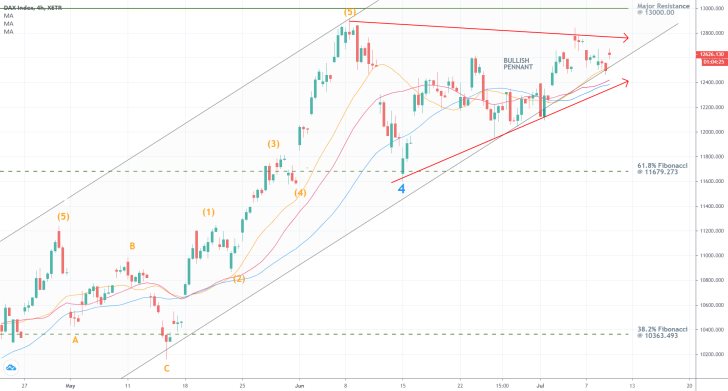
The 4H chart below confirms the existence of a marginal consolidation in the short-term. The price action appears to be forming a bullish pennant pattern, which commonly represents breaks in the development of a broader bullish trend. Such 'breaks' take place before the market resumes going further north. Usually, the price action has to make at least two points of contact with the Pennant's lower limit, coupled with one point of contact with its upper edge, before a substantial breakout can be formed.
Therefore, the price action could fall to the lower trend line (in red), which serves as the bottom limit of the Pennant, before such a breakout is attempted. For the time being the price action is concentrated above the ascending channel's lower boundary, which could be enough for the market. In other words, the DAX does not necessarily have to fall to the lower extreme of the Pennant before a breakout is established.

The 20-day MA (in orange) is currently threading above the 30-day MA (in purple), which, in turn, is threading above the 50-day MA (in blue). This correlation between the three moving averages is demonstrative of a solid bullish commitment in the market. For as long as this relationship is maintained, no substantial bearish corrections are likely to emerge.
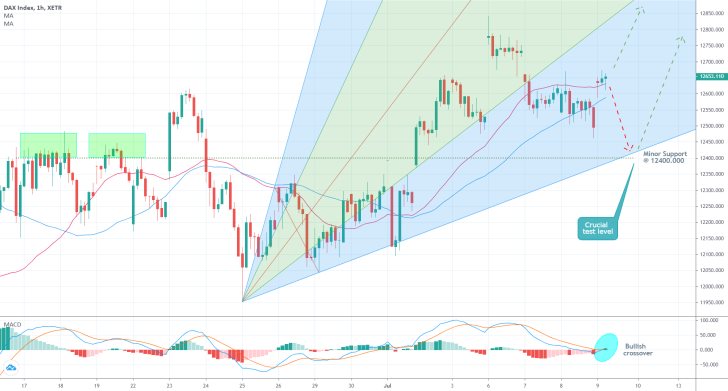
The minor support level at 12400.00, which is represented on the hourly chart below, currently coincides with the pitchfan tool's lowest edge. This convergence represents the lowest possible level that the price action could sink to in the very-short-term before any support can be found.
Meanwhile, the price action remains trading above the 50-day MA (in blue) and the 30-day MA (in purple), which is evocative of strong bullish commitment. This is further supported by the manner in which the price action rebounded at today's market open – the bearish Marabozu candlestick from yesterday's close was quickly invalidated by the big positive gap at today's open.
Finally, the MACD indicator recently formed a bullish crossover, which substantiates the expectations for continuous appreciation, as the underlying bullish momentum rises in the short-term.

3. Concluding Remarks:
The DAX index looks poised to test the strength of the resistance level at 13000.00, which was last reached before the coronavirus crash. This is expected to lead to heightened volatility around set level, which could make trading unfavourable for more risk-averse traders.

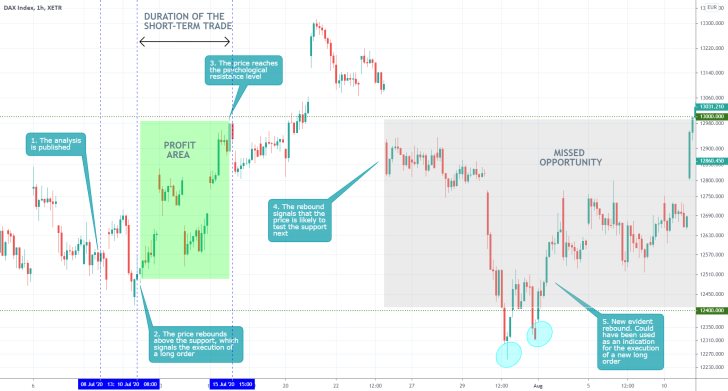
- Undoubtedly the strongest advantage of the analysis was its excellent technical observations. It could have, however, done more in explaining how the underlying fluctuations could have been exploited better.
Disclaimer: Your capital is at risk! Trading and investing on the financial markets carries a significant risk of loss. Each material, shown on this website, is provided for educational purposes only. A perfect, 100% accurate method of analysis does not exist. If you make a decision to trade or invest, based on the information from this website, you will be doing it at your own risk. Under no circumstances is Trendsharks responsible for any capital losses or damages you might suffer, while using the company’s products and services. For more information read our Terms & Conditions and Risk Disclaimer.


