German stocks benefited from the Pfizer and BioNTech news from the other day concerning the massive success of their developmental vaccine in early trials; namely, the success of the vaccine in preventing symptomatic infections in volunteers.
The DAX index is currently about to test a crucially important resistance area that was last reached in the wake of the coronavirus turmoil. Even still, there are plenty of reasons to doubt the unimpeded continuation of the current rally.
On the one hand, despite the great promise that the potential COVID-19 vaccine is showing, there is still a significant lagging factor to consider. It might be weeks and even months before it can be transported across the world, so major logistical obstacles could impede the fight against the pandemic in the midterm. Hence, in spite of the initial market excitement stemming from the news, investors optimism could quickly wane as governments scramble to overcome these and other problems.
On the other hand, the continually growing number of confirmed cases in Germany and elsewhere remains a constant source of fallout for the DAX. Given that the ECB would continue monitoring the situation until December, the European stock market would not be able to rely on new monetary policy interventions by the end of the year.
Given the overall uncertainty that remains, the DAX could fail to break out above the above-mentioned resistance area, which would result in the establishment of a new bearish correction. The purpose of this analysis is thus to examine the likelihood of this possibility.
1. Long-Term Outlook:
As can be seen on the daily chart below, the price action of the DAX is currently concentrated in a range within a broader range – namely, between the support level at 12300.0 and the resistance level at 13200.0. This range emerged as a major consolidation area, especially after the last bearish correction. The latter reached the psychologically significant 61.8 per cent Fibonacci retracement level at 11684.500 before the latest rebound took place.
The V-Shape rebound (not to be confused with the economic term) is quite important for several reasons. Its shape and size underpins considerable bullish commitment in the market over the last several days, and such a decisive rebound from the Fibonacci barrier typically entails trend-continuation. Nevertheless, the Resistance Area (in blue) could prove to be a substantial obstacle for the continuation of the rally.
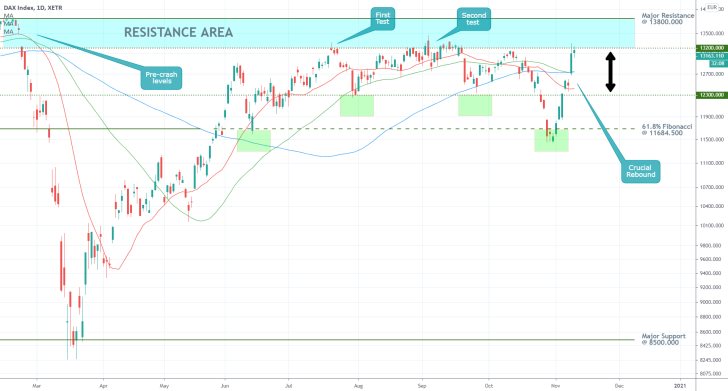
On the one hand, the emergence of the huge Marabozu candle from the 100-day MA (in blue) and the 50-day MA (in green) yesterday confirms the aforementioned bullish bias. On the other hand, the price action has already bounced back from the lower boundary of the Resistance Area at 13200.0 on three separate occasions. This means that the latest upsurge is going to have a difficult time ahead in breaking out above this substantial obstacle.
If the price action manages to penetrate above the resistance level, this will clear the way for the upswing to continue advancing towards the upper border of the Resistance Area at 13800.000. The latter also has psychological significance due to the fact that it was last tested prior to the outbreak of the coronavirus. Conversely, another rebound from the 13200.0 resistance could very likely lead to subsequent development of a new bearish pullback, which could drive the price action towards the closest support level at 12300.0.
2. Short-Term Outlook:
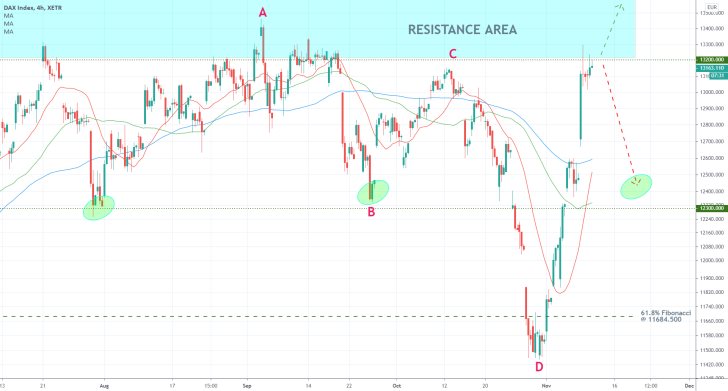
The last bearish correction takes the form of a massive ABCD pattern, which means that the current upswing emerged after the bearish pattern was concluded. This retracement has a little less than 200 basis points to advance further north before it completely exceeds the combined length of ABCD's two impulse legs – AB and BD.
This basic measurement reveals that the classic reversal setup following the emergence of such an ABCD pattern could be completed soon (if it already hasn`t), which, in turn, implies that a new bearish correction might be overdue. Given how the price action has consolidated just below the Resistance Area's lower boundary over the last several hours, such projections can be soon realised. At any rate, even if the price action manages to break out above 13200.0, it could yet change its direction approximately 200 basis points above the resistance – around 13400.0.
Should the price action start falling in the very near future, the lowest that it is conceivably likely to sink is around the range of 12300.0 - 12500.0 before it finds the necessary support. Given that the 50-day MA and the 20-day MA (in red) are still threading below the 100-day MA, the emergence of such a bearish correction seems very plausible.
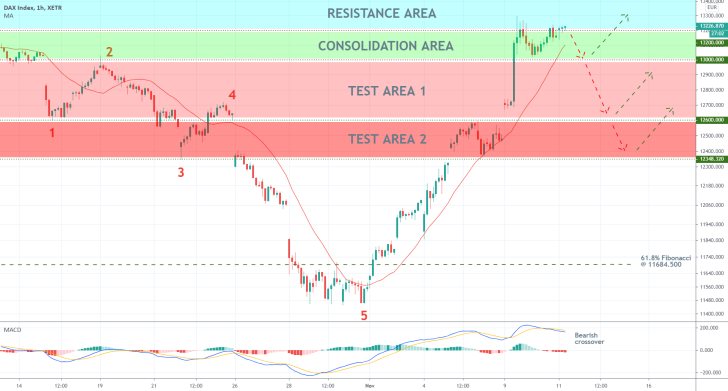
The hourly chart below demonstrates the potential scenarios under which a new bearish correction could emerge soon, provided that the price action rebounds from the 13200.0 resistance. Notice that the CD leg is represented as a bearish 1-5 impulse wave patter, as postulated by the Elliott Wave Theory.
The Consolidation Area (in green) extends to the psychological support at 13000.00, which was established as a prominent turning point when it terminated the 1-2 retracement. Bulls could look for opportunities to join the existing uptrend around this support, which looks like the most plausible turning point.
Test Areas 1 and 2 are also plotted using the swing lows and swing highs of the 1-5 impulse wave pattern. A considerable bearish bias would be needed for the price action to sink to them. The MACD indicator, which registered a bearish crossover recently, could demonstrate such rising commitment.
3. Concluding Remarks:
The underlying setup seems favourable for the implementation of swing trading strategies on the expectation for the development of a new bearish correction. Such trading strategies, however, would also entail a high degree of risk given the prevailing uncertainty in the market. More risk-averse traders could instead wait for such a potential correction to be completed so that using trend-continuation strategies they could join the existing bullish trend.
The DAX Takes a Breather
The German stock market appears to be taking a short break after the turbulent past several weeks. The DAX index has been consolidating in a tight range over the last few days, as the market relaxes after the sudden surge of investors' enthusiasm following the BioNTech and Pfizer vaccine news.
The temporarily subdued price action is thus mostly attributed to the oversaturation of the market with prominent news – from the latest coronavirus developments to the barricading of Donald Trump at the White House and his refusal to concede a defeat. The time, therefore, seems right for market participants to take in all of these aspects and cool down the 'animal spirits' that drove the preceding price fluctuations. Also, the lack of major economic releases this week is a contributing factor to the overall muted price action.
It follows that the current consolidation of the DAX represents an interim stage in the directional trading of its price action. In other words, an eventual breakout/breakdown outside of the range's boundaries is going to entail the next most probable direction for the price action. Therefore, it is worthwhile to examine the current market setup, which would allow traders to prepare for the next big movement of the DAX before the market dynamics change yet again.
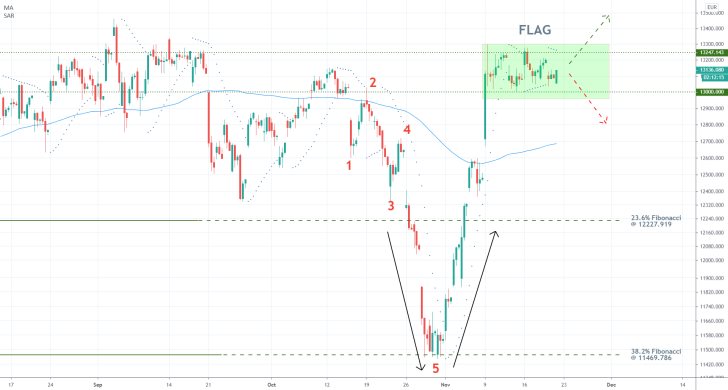
As can be seen on the 4H chart above, the sudden seesaw recovery from the 38.2 per cent Fibonacci retracement level to above the 23.6 per cent Fibonacci at 12227.919 was the result of the aforementioned fundamentals – the aftermath of the US election and the vaccine news.
This V-shaped rebound manifests not only a sudden change in the underlying demand dynamics but also the existence of quite a significant bullish pressure. It follows that the price action is more likely to continue heading up north after the termination of the current range, as opposed to tumbling yet again. That is not to say that the market bulls retain full control at the moment, but rather that the impact of the aforementioned heightened investors' enthusiasm is more likely to have a continued positive impact on the DAX.
At present, the price action is consolidating in a tight range between the psychologically significant support at 13000.00 and the minor resistance at 13250.00 – a Flag pattern. A breakdown below the former or a breakout above the latter would potentially signify the momentary control of either the market bears or market bulls. Hence, traders need to watch carefully the manner in which the price action would break outside of the range.
As was established earlier, the underlying fundamentals seem favourable to the bulls, which implies the use of trend-continuation trading strategies. These expectations are backed up by the fact that the psychologically significant support at 13000.00 represents a major obstacle for the bears.
At any rate, even if the price action manages to break down below the range, it is more than likely to find strong support around the 100-day MA (in blue). Conversely, a breakout above 13250.00 would clear the way for the bulls to test the next resistance level around the previous swing high at 13450.00, and beyond.
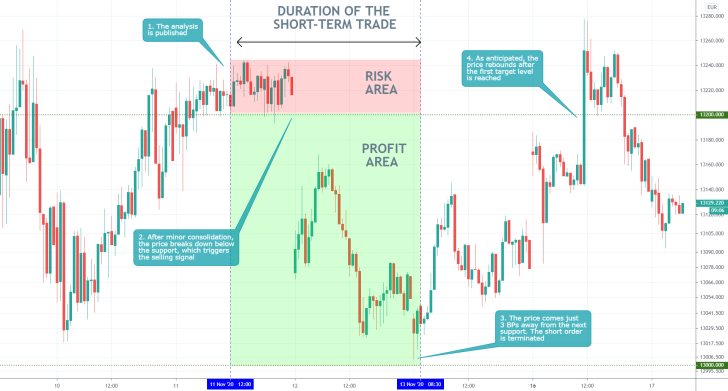
- The analysis has an excellent sense of timing, as the price action started falling shortly after its publication. The analysis was also quite correct in anticipating a likely reversal after the price action had reached the psychologically significant support at 13000.000.
- Notice that the price action came just several basis points away from the support before it changed directions – traders should be especially cautious when they use take profit orders around such prominent levels, because they may not be triggered. That is so because many traders typically chose to enter/exit the market around such significant levels, which sometimes leads to adverse volatility.
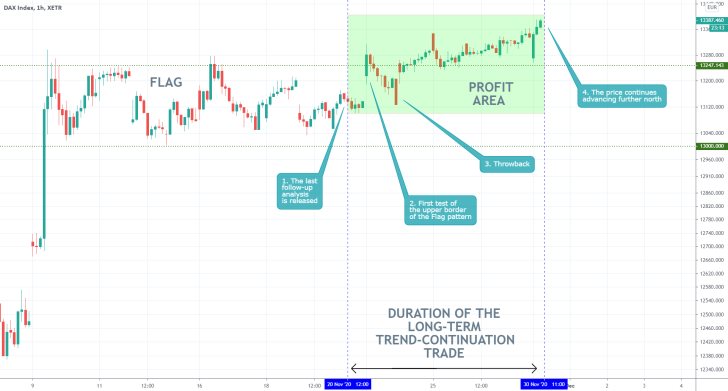
- The last follow-up was quite right in expecting a successful breakout above the Flag's upper border as a consequence of the renewed investors optimism. It was a classic breakout play – an initial probe, followed by a misleading throwback, and the eventual decisive breakout.
Disclaimer: Your capital is at risk! Trading and investing on the financial markets carries a significant risk of loss. Each material, shown on this website, is provided for educational purposes only. A perfect, 100% accurate method of analysis does not exist. If you make a decision to trade or invest, based on the information from this website, you will be doing it at your own risk. Under no circumstances is Trendsharks responsible for any capital losses or damages you might suffer, while using the company’s products and services. For more information read our Terms & Conditions and Risk Disclaimer.


