The cable remains on its ascending course in spite of, or perhaps precisely because of, all of the recent developments. The BioNTech and Pfizer vaccine news coupled with Moderna's promising performance have reinvigorated investors' enthusiasm. Markets are riding high at present because investors believe that such a game-changing vaccine would allow global economic activity to reach pre-pandemic levels swiftly.
Meanwhile, Joe Biden's victory in the US elections has stirred additional volatility as his policies at the White House are prone to be starkly different from the protectionist agenda of Donald Trump. The new administration in Washington is almost certainly bound to open up new possibilities for the global markets, which would undoubtedly affect the underlying supply and demand equilibriums for multiple assets.
In other words, the greenback suffered from all of these recent developments as investors look at them with optimism, which consequently weighs down on the global demand for the world's most convertible currency.
As regards the recent economic developments, the poor retail sales data in the US from yesterday stifled the demand for the dollar even more. In contrast, the current bullish run of the pound was not impeded even by the poor GDP data of the British economy in Q3; nor was it weighed down by the rising unemployment rate.
Overall, the GBPUSD looks set to continue appreciating in the near term, driven by solid fundamentals. However, the pair is drawing near to a major resistance level with historical importance, which is where contrarian traders would be looking for opportunities for a trend reversal.
1. Long-Term Outlook:
As can be seen on the daily chart below, the price action remains appreciating within the boundaries of an ascending channel. It is about to test the strength of the major resistance level at 1.34000, which is where a reversal is most likely to occur. The last time that the price action came near this psychological barrier, it finished establishing a massive bullish trend. The resulting Evening Star pattern (the area in blue) underpins the termination of the trend.
Now as the price action is about to test the 1.34000 resistance for a second time, another potential reversal would entail the emergence of a substantial Double Top pattern. Double tops typically entail the likely development of new bearish trends, which is why another rebound from 1.34000 will represent a considerable bearish indication.
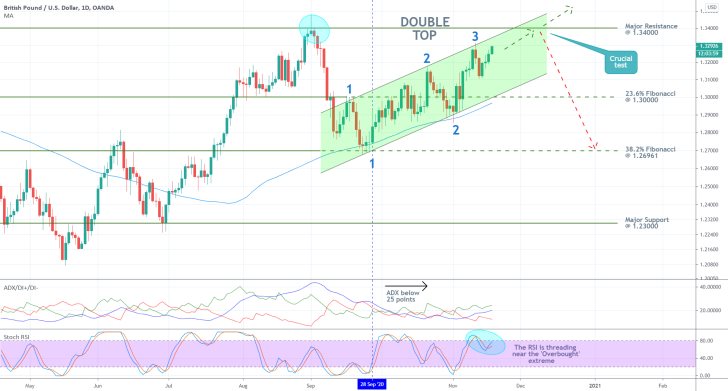
While a breakout above the resistance is not entirely impossible, especially given the aforementioned fundamentals, its likelihood seems improbable. Firstly, the ADX indicator has been threading below the crucial 25-point mark since the 28th of September, which means that the market continues to be technically range-trading. Typically, only a strong trending sentiment would be able to drive the price action past such major obstacles.
Secondly, the Stochastic RSI indicator is currently threading near its 'Overbought' extreme. While this does not necessarily mean that another rebound is imminent, the reading of the indicator is likely to prompt many traders to action. Consequently, many short orders are likely to be placed around the resistance level, which would, in turn, have an adverse impact on the demand for the pair.
Finally, notice that the price action has already had three points of contact with the channel's upper border and two points of contact with its lower border. Given that there is still plenty of bullish commitment left in the market, the price action could test the two limits of the channel at least two more times before a decisive reversal takes place.
Moreover, the two dips of the channel bottomed out at the 100-day MA (in blue), which means that the moving average remains a major floating support and something that contrarian traders need to observe carefully. The emergence of a new massive downtrend would require a decisive breakdown below the 100-day MA, the lower border of the channel, and also below the 23.6 per cent Fibonacci retracement level at 1.30000. The latter also bears significant psychological importance, and as such represents a potential turning point.
2. Short-Term Outlook:
The 4H chart below demonstrates one potential scenario in which such a reversal could occur. At present, the price action appears to be in the early stages of developing a Head and Shoulders pattern, which also entails bearish reversals. If it goes on to behave as projected, the Head of the pattern will represent the aforementioned test of the major resistance at 1.34000. Moreover, such an upswing would also manifest the fourth point of contact of the price action with the upper edge of the channel, which would complement the above-mentioned assertions.
The minor support level at 1.31600 is taken as a rough guideline for a potential Neckline of the pattern; however, the price action could fall as low as the lower limit of the channel before the Right Shoulder is created. In turn, this would fulfil the expectations for at least one more point of contact of the price action with the lower edge of the channel before a decisive breakdown occurs.
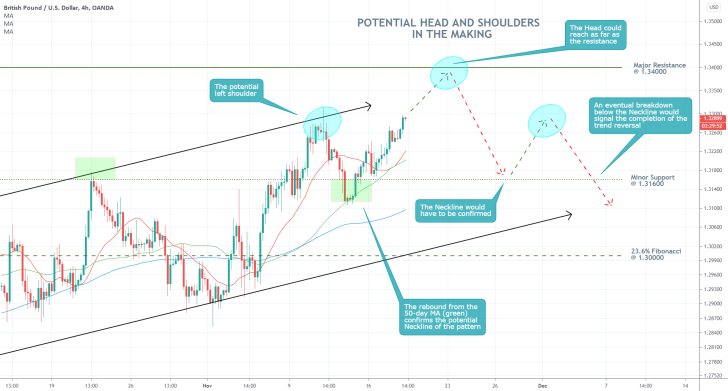
Less risk-averse contrarian traders could look for opportunities to enter short around the major resistance level at 1.34000, but more risk-averse traders would like to see the Head and Shoulders pattern fully completed before they can join the newly emerging downtrend. A breakdown below the Neckline of the pattern would entail such a decisive confirmation of the changing market dynamics.
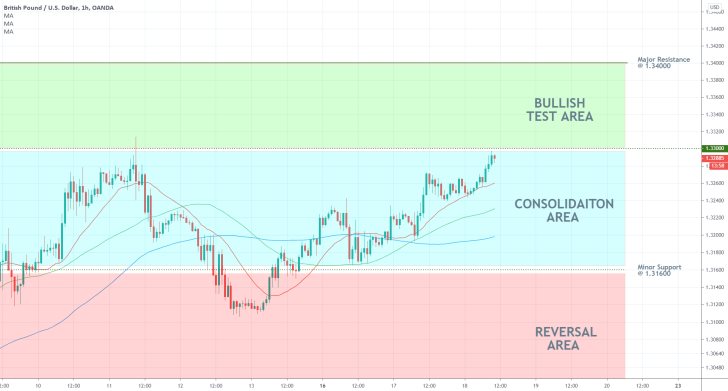
As was already established, the price action is most likely to continue appreciating in the immediate future, as it prepares to test the resistance. The bulls who do not have already open positions should refrain from joining the market at the present rate because the risk is too great. Instead, they should look for trend-continuation trading opportunities if the price action manages to establish a decisive breakout above the resistance.
Conversely, the bears would be looking for trend-reversal opportunities, as was mentioned earlier. Joining the market within the boundaries of the Consolidation Area, which spans between the minor support at 1.31600 and the minor resistance at 1.33000, would entail a considerable risk for the bears. That is so because such major trend reversals are usually associated with erratic price fluctuations.
Moreover, the perfect ascending order of the three moving averages – the 20-day MA (in red) is positioned above the 50-day MA (in green), which is positioned above the 100-day MA (in blue) – is preserved at present, which underscores strong bullish commitment.
3. Concluding Remarks:
While the trading opportunities for the market bulls are evident, the bears should be patient. Contrarian trading requires precision and caution. Once the price action enters within the Reversal Area, and traders recognise the completion of the Double Top pattern on the daily chart or the Head and Shoulders pattern on the 4H chart (or both), only then they will have enough evidence to support the expectations for a new bearish trend.
Cable's Expected Reversal May Be Already Here
As per the projections of the initial analysis, the GBPUSD advanced to the major resistance at 1.34000. Now that the price action is consolidating below this psychological barrier, it may be time for the bears to regain control. In the analysis was argued that a potential trend reversal is likely to originate from this resistance, which is why today's follow-up examines the possibilities for such an outcome.
So far in the third quarter, the pound was one of the big gainers while the greenback suffered considerably from the coronavirus fallout. The reasons for this dichotomy are complex, but they essentially boil down to the following. In light of persisting uncertainty, investors have been scrambling for safe-haven assets such as gold, and other low-risk securities like Government bonds.
Consequently, the global demand for the greenback waned parallel to gold's rally. As the world's most popular and convertible currency was depreciating, others such as the pound were strengthening. This inverse relationship is now changing.
Global investors' enthusiasm was reinvigorated recently following the release of the promising news concerning the development of a viable Covid-19 vaccine. Investors and traders saw these as an indication that the coronavirus uncertainty is about to diminish greatly, which stymied the global demand for safe-havens. This was the primary catalyst for a likely change in the demand dynamics of the GBPUSD.
The greenback is now likely to advance alongside the energy market, whereas the overbought pound is once again exposed to the Brexit uncertainty. Boris Johnson's government has until the 31st of December to reconcile its demands with the European Commission. With time promptly running out and the negotiations impasse still being far from resolved, a no-deal Brexit at the end of the year seems increasingly more plausible with each passing day.
The underlying fundamental factors seem to favour a forthcoming trend reversal on the GBPUSD, but what does the current technical setup look like?
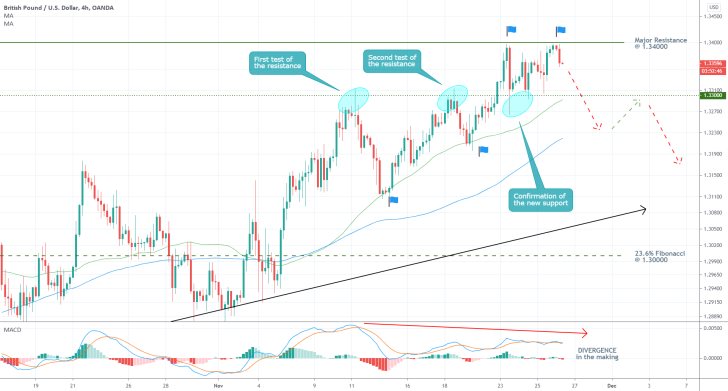
As can be seen on the 4H chart above, GBPUSD's price action is indeed consolidating just below the major resistance level at 1.34000. This setup looks suitable for the implementation of trend-reversal trading strategies, but contrarian traders should be aware that there is a risk of adverse fluctuations and false breakouts above the resistance. That is why less risk-averse traders, looking to enter the market around the current price, need to place narrow stop-losses, and potentially be prepared to have to open several positions before they gain the desirable entry.
In contrast, risk-averse traders could wait for a more significant bearish confirmation. Once the price action breaks down below the support at 1.33000, they can look for entry opportunities using trend-continuation trading strategies. Preferably at the peak of the first bullish correction.
Both types of traders need to be aware that the price action still can break out above 1.34000 decisively, and continue appreciating further north.
Why is the 1.33000 level so important? It has already been tested on three separate occasions, each one of which being followed by a rebound. That is why due to the strength of this level, which is currently serving the role of a support, an immediate reversal may not take place. Instead, the price action could continue consolidating in range before the bears gain more support.
The MACD indicator is currently underpinning the development of a Divergence – bearish momentum gaining as the previously bullish momentum wanes. Moreover, the two EMAs of the indicator look poised to establish a bearish crossover, which represents another positive factor for the sellers.
The 50-day MA (in green) represents a floating support of significant importance. The price action has already rebounded from it on two separate occasions, so the bears need to monitor the behaviour of the price around it in the near future carefully. Moreover, the moving average is currently converging towards the 1.33000 support, which makes it an even more significant barrier for a potential bearish reversal.
If the price action manages to break down below it, the next two obstacles are encapsulated by the 100-day MA (in blue) and the ascending trend line. Either one of these could potentially cause the emergence of a minor bullish correction – possibly towards 1.33000 (then serving as resistance) – before the broader downtrend is resumed. This would allow for the implementation of trend-continuation strategies.
The first major goal for such a new downtrend is represented by the 23.6 per cent Fibonacci retracement level at 1.30000, which bears considerable psychological importance.
The Hype Train Continues
The GBPUSD is once again on the rise owing to reinvigorated optimism for a Brexit deal. The pair reached its highest peak in a year as the greenback continues to tank.
You can read more about the broader reasons that have led to the depreciation of the dollar from our last EURUSD follow-up. The purpose of this GBPUSD follow-up is to expound upon the latest phase of the Brexit negotiations and to underpin the impact of this heightened optimism.
Britain and the EU have until the 31st of December to strike mutually-satisfying accords, and the market anticipates that such a deal can be reached within the next following days. After gruelling four years of difficult negotiations, the market is now seeing the prospects of such a last-minute deal as a cathartic end to this excruciating process.
The rally of the pound represents the ultimate expression of this heightened enthusiasm and all of the hopes of traders and investors associated with the 'happy' conclusion of the divorce process for all concerned parties. But just how realistic are these expectations?
The focus of the market is not placed as much on the likely ramifications from a potentially unsatisfactory deal, but rather on whether an agreement is reached at all. Regardless, sooner or later, the market will have to come to grips with the realisation that a potentially bad deal is not necessarily better than no deal at all. In other words, it remains to be seen whether a trade deal, if one is struck by the 31st at all, is going to be good for the British economy in the long-term or not.
Meanwhile, the achievement itself would very likely represent the peak of demand for the cable, which could then be followed by a possible bearish correction. In the immediate future, however, the market looks poised to continue rallying, being driven by this bolstered enthusiasm. Nevertheless, these 'Animal Spirits' look largely unfounded, which is why it is yet uncertain just how high the price of GBPUSD could climb further before it comes crashing down – it could happen at the current market price, or it could be much higher. The unfathomable nature of this heightened enthusiasm is what makes it so unpredictable.
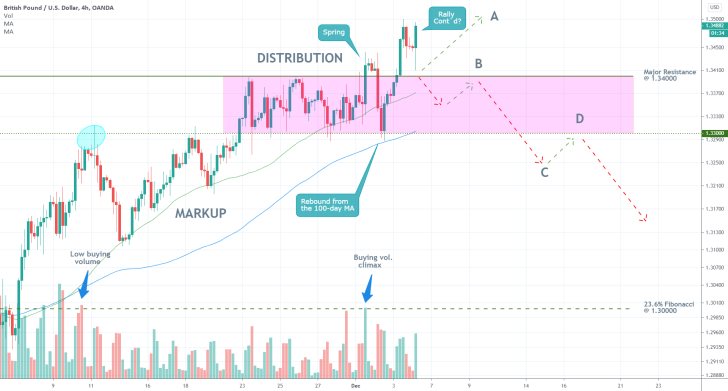
As can be seen on the 4H chart above, if the aforementioned market optimism continues driving the price action in the immediate future, it cannot be said just where the upsurge will peak (point A). Nevertheless, if it ceases playing such an important role in the near future, then the complete trend reversal is likely to unfold in the depicted manner.
The transition from the current Distribution (previously Markup) into a new Markdown is likely to occur in several key stages, as postulated by the general Wyckoff theory. The first necessary step would entail a dropdown below the major resistance (currently support) level at 1.34000. The latter serves the role of an upper boundary of the Distribution range.
Notice that the lower boundary of the range (at 1.33000) was established as a swing high of the preceding Markup. At that point, the market had reached a low point in the underlying buying volume. That is why the transition of the market sentiment depends so much on the underlying volume. Moreover, the recent buying climax could potentially entail a subsequent reversal – the current attempt for a continuation of the rally turning into a failed breakout.
If the price action does indeed retrace back to the Distribution range, the second phase will entail a last-ditch attempt at a trend continuation (at point B). Afterwards, the price would attempt a breakdown below the lower boundary of the range (point C), followed by a throwback (point D). That would entail the last step before the emergence of a new Markdown.
These are the potential steps that trend-reversal traders need to watch for when seeking favourable entry levels. In contrast, trend-continuation traders could look for an opportunity to place long orders in case of a bullish rebound from 1.34000, but they should keep in mind that there is no way of knowing just when the market would cease being driven by the underlying optimism.
GBPUSD Ready to Break the Distribution Range
There is now more evidence pointing to the formation of a new major downtrend on the GBPUSD, following up on our last analysis of the pair. The cable started off the week on a high note as British Prime Minister Boris Johnson went to Brussels in a bid to salvage a trade deal in a face-to-face talk with the President of the European Commission Ursula Von Der Leyen. However, the pound plunged yesterday after the negotiations have reportedly hit a new roadblock, as the two key figures failed to break through the impasse at the first formal dinner.
The two sides continue to exhibit a willingness to come to terms with each other, and they have committed themselves to make a decision by this Saturday.
We had a lively & interesting discussion on the state of play on outstanding issues.
— Ursula von der Leyen (@vonderleyen) December 9, 2020
We understand each other's positions. They remain far apart.
The teams should immediately reconvene to try to resolve these issues. We will come to a decision by the end of the weekend. pic.twitter.com/jG0Mfg35YX
It remains to be seen whether a mutually satisfying outcome would be secured, which would undoubtedly have a great impact on the value of the cable. The immediate effect of a trade accord would be one of appreciation of the pound, as traders' optimism would bolster such a scenario. In contrast, a failure to break off the deadlock would result in more woes for the sterling.
The point that seems to have been missed by both bulls and bears is that the longer-term implications are going to be much less concise. Regardless of whether the UK clinches a trade deal with the European bloc, there are certainly going to be major transformational changes in the following months. Consequently, the overbought GBPUSD is certainly going to come to grips with the reality of the Brexit process in the months to follow after the temporary impact of the 'animal spirits' subsides.
It just so happens that these final crunching stages of the negotiations coincide with the historically low point of the greenback, which is only exacerbated by this trade deal optimism at present.
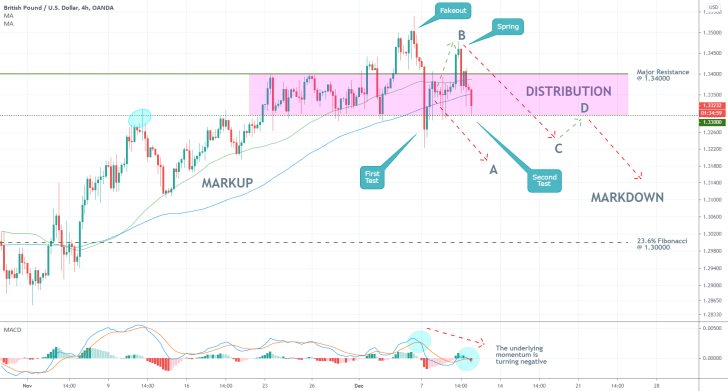
As can be seen on the 4H chart above, the price action is behaving exactly as expected. Following the release of the last follow-up, the price action established a 'Spring' pattern above the upper boundary of the Distribution range, at point B. Since then, it rebounded yet again and is currently testing the strength of the range's lower edge.
A decisive breakdown would allow for the future development of a new Markdown towards the 23.6 per cent Fibonacci retracement level at 1.30000. The latter bears significant psychological importance.
Notice also that the price action is attempting to break down below the 100-day MA (in blue) for a second time, which underscores the bearish commitment in the market.
Finally, the MACD indicator highlights the rising bearish momentum in the market, which represents yet another signal for the likely emergence of a new bearish downtrend.
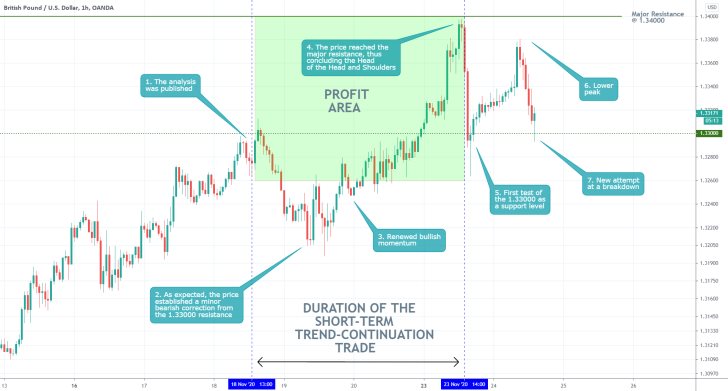
- So far, the projections of the analysis are being realised in almost their entirety. The price action did indeed reach the major resistance level at 1.34000 before rebounding from it, which concluded the establishment of the Head of the Head and Shoulders Pattern. Given the emergence of a subsequently lower peak, the expected accumulation of bearish pressure has already commenced. Bears can start looking for opportunities to join the market.
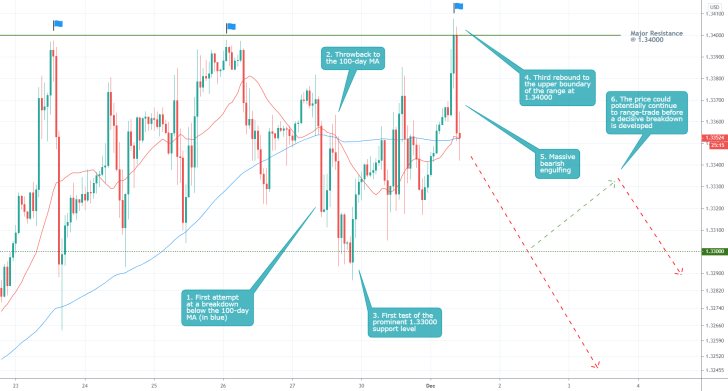
- So far, the price action is behaving as per the forecasts of the last follow-up. It is concentrated in a tight range spanning between the major support at 1.33000 and the major resistance at 1.34000. Notice that both of them have been tested once since the follow-up was published. This ranging environment is likely to continue in the near future until the bears gain more control.
- The primary forecasts remain the same – an eventual breakdown below 1.33000, and the establishment of a new downtrend. Sellers should be cautious of likely erratic fluctuations within the range, and potential fakeouts above 1.34000.
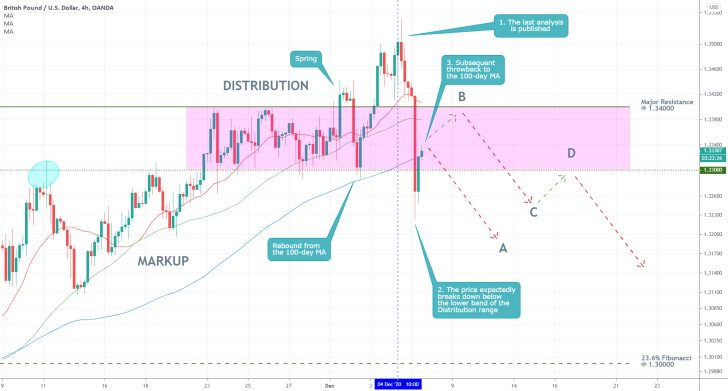
- As projected by the last follow-up analysis, the price action of the pair plummeted today on the latest Brexit negotiation tribulations. The GBPUSD fell below the lower boundary of the Distribution range, but the price action subsequently established a throwback to the 100-day MA (in blue). The latter is currently serving the role of a floating resistance.
- The price action can either rebound from the 100-day MA, in which case the new Markdown will begin its development right away (scenario A); or it can correct itself towards point B (upper boundary of the range) before the price resumes falling once again. Both scenarios entail trend-continuation trading opportunities. Traders who already have open positions (short trades) better move their SLs at breakeven (just above the major resistance at 1.34000).
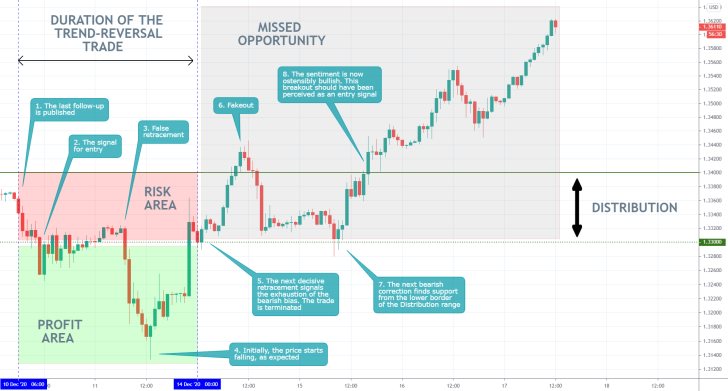
- Overall, the last follow-up did a good job of demonstrating the conditions under which the price action would establish a trend reversal. However, what was even more useful, was the fact that it cautioned traders against the possibility of a fakedown, which is what eventually transpired. That is why the losses were limited to the rebound above the Distribution's lower band.
- What could have been done better was to take advantage of the subsequent bullish momentum. The follow-up underpinned the importance of the Brexit trade deal optimism, which is why a long position could have been opened following the decisive breakout above the Distribution's upper boundary.
- Traders shouldn`t be afraid to act on any incoming evidence that runs contrary to their initial expectations.
Disclaimer: Your capital is at risk! Trading and investing on the financial markets carries a significant risk of loss. Each material, shown on this website, is provided for educational purposes only. A perfect, 100% accurate method of analysis does not exist. If you make a decision to trade or invest, based on the information from this website, you will be doing it at your own risk. Under no circumstances is Trendsharks responsible for any capital losses or damages you might suffer, while using the company’s products and services. For more information read our Terms & Conditions and Risk Disclaimer.


