Temperatures dropped drastically last week across the U.S. and Western Europe, prompting a marked upsurge in energy demand. Record lows were reached in many states as the coldest weather in over 30 years continues to grip the U.S, with more than 150 million people remaining under a weather alert.
The severe temperatures have caused a sudden jump in energy consumption across the most affected states, causing power outages and blackouts. The bolstered demand for energy affected the price of crude as well, with the commodity breaking out above the psychological resistance at 60.00 at the end of last week.
The weather forecasts expect the cold weather to persist in the U.S. and western Europe over the next few days, likely keeping the demand for crude high. This is good news for bulls hoping for consolidation of the price action above 60.00.
The weather looks poised to remain the most decisive factor for the price of the commodity in the near term, given that there are not many economic events scheduled for the next few days that could affect the underlying price. Meanwhile, crude's rally continues to advance parallel to Bitcoin's own hike, as investors remain interested in high-risk securities.
This is due to the historically low yields in the U.S., brought about by FED's massively accommodative monetary policy. For the same reason, safe-havens continue to dive, which is clearly visible on the price action of gold.
Overall, all factors seem to be pointing to a very probable continuation of crude's ascent. However, that is not to say that the rally is all but certain. Psychological barriers such as the 60.00 resistance frequently serve the role of turning points for the price action's underlying direction, which is why the possibility of a bearish correction should not be completely dismissed.
1. Long-Term Outlook:
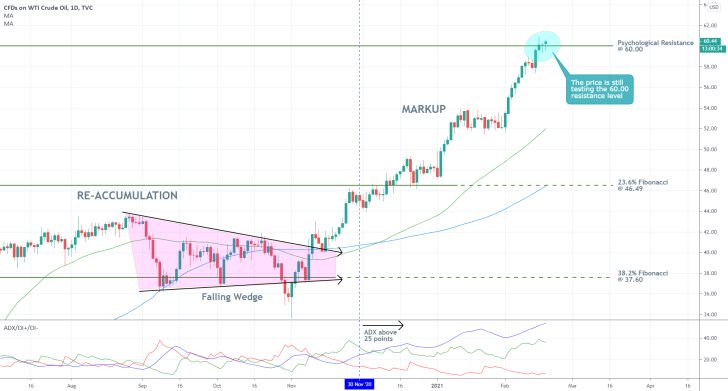
As can be seen on the daily chart below, the price action is indeed trying to consolidate above 60.00 at the present moment. The latest Markup represents a key component of a broader Wyckoff cycle. Given that the ongoing rally is not showing any signs of slowing down as of yet, bears are still left waiting for the emergence of a new Distribution range.
Shortly after the price action broke out above the Falling Wedge, which is a pattern that typically entails the continuation of an existing uptrend, the ADX indicator started advancing above the 25-point benchmark. The Markup (uptrend) is presently at its strongest, which confirms the expectations for a likely trend-continuation. At the same time, this also means that contrarian trading will be exceptionally risky if done at the current moment.
2. Short-Term Outlook:
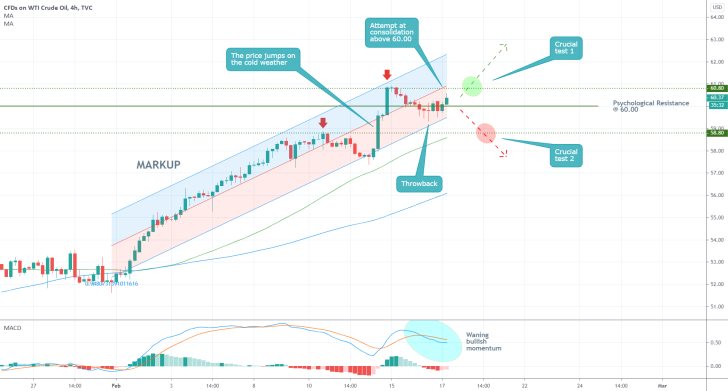
The latest portion of the Markup is examined in greater detail on the 4H chart below. As shown, the sudden temperature drop last week inadvertently caused the breakout above 60.00. It reached a swing peak at 60.80 before creating a throwback to the psychological barrier.
At present, the price action is consolidating in a tight range between the two levels, as well as in the lower part of a regression channel. Bulls eyeing a possibility to implement trend-continuation strategies can look for an opportunity to go long near the bottom of the throwback. A crucial test for confirming the continuation of the Markup would be a breakout above 60.80, and the middle line of the regression channel. They should keep in mind that the underlying bullish momentum is currently falling, as demonstrated by the MACD indicator.
In contrast, bears wanting to practice short-term contrarian trading (given that the underlying trend remains ostensibly bullish) will be looking for signs of a decisive retracement below the 60.00. The next bearish test is at 58.80, which highlights the previous swing peak. The 58.20 support is also about to converge with the 50-day MA (in green), representing a floating support. Thus, a potential dropdown to the two would demonstrate the real strength of the current bearish commitment in the market.
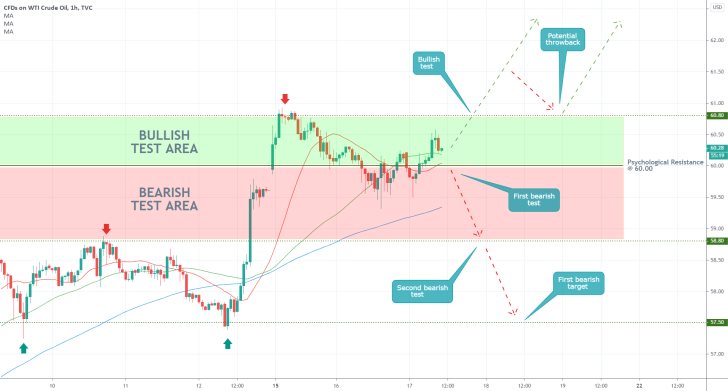
As can be seen on the hourly chart below, the price action appears ready to probe the Bullish Test Area's upper boundary. Bulls looking to go long at the current market price should be cautious of potential adverse fluctuations to the bottom of the throwback (in the Bearish Test Area, around 59.50). After a possible breakout above the Bullish Test Area's upper boundary, they should keep in mind that the price could yet fall back to 60.80, which would allow them to add up to their existing positions.
Conversely, bears should not even consider opening any selling orders before the price falls below the 50-day MA, the 20-day MA (in red), and the psychological support at 60.00. As stated earlier, the next bearish test would be at 58.80. A potential breakdown below it would clear the way for a more sizable dropdown to 57.50, which represents the last major barrier.
3. Concluding Remarks:
The biggest risk for bulls joining the market just now is encapsulated by the fact that the price of crude has already moved by a significant margin since the beginning of the Markup. In other words, they will not be getting the best possible entry. Since it is unclear just how much further can the price of crude advance above 60.00, bulls could be better-off using floating stop losses and take profits. Keep in mind that currently, the commodity's price is directly being influenced by the cold weather, which relationship could change just as abruptly as it began last week.
Meanwhile, the risk for bears is comparatively bigger precisely because of the strength of the uptrend. Even if the price action does break below 60.00, it is unlikely that this would result in the immediate beginning of a new downtrend. Consequently, bears will be eyeing a much smaller bearish correction to one of the aforementioned test levels. Such type of contrarian trading is not recommended for highly risk-averse traders.
What Can Jolt Crude's Rally?
The price of crude oil reached 63.00 dollars per barrel during today's trading session, which met this year's previous record from early-January. The commodity's seemingly relentless rally was bolstered last week, owing to the poor weather conditions in the U.S., particularly in the southern states. The power outages in Texas coincided with a massive upsurge in energy demand, which increased the aggregate demand for crude oil.
Moreover, the freezing cold temperatures impeded production, resulting in sub-optimal refinery output. Today's U.S. crude oil inventories data was quite informative as regards the impact of the storm on net production.
The underlying supply and demand equilibrium continues to be favouring the continuation of crude's rally for the time being; however, things could change soon. Given that U.S.' commercial stockpile looks poised to continue expanding over the coming weeks, supply is likely to rise as a result. This would undoubtedly affect the underlying rally, potentially causing a temporary reversal.
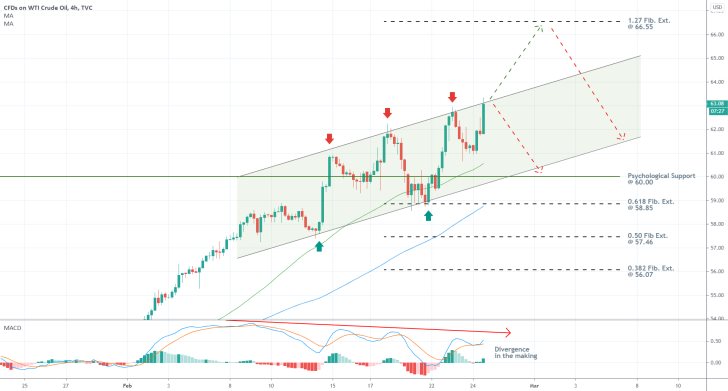
As can be seen on the 4H chart above, the underlying price action broke out above the psychological resistance at 60.00 recently, which underpins the strong buying pressure at present. This happened following a minor throwback below the support, which was terminated above the 50-day MA (in green).
The price action continues to advance within the boundaries of an ascending channel. The next most likely target level for the uptrend will be the 1.27 Fibonacci extension at 66.55, provided that bulls manage to retain control in the near term. However, this may not be realised if demand falters, as was argued in our latest update.
Notice that the MACD indicator underpins a divergence in the making. This is inlined with the expectations for a trend reversal. Nevertheless, market bears should not take this as a sign of an immediate correction, as there is still potential for further price hikes.
A decisive breakdown below the psychological support at 60.00 is needed for bears to have their strong confirmation. If the price action does indeed manage to fall below this support, it could also attempt diving to the 0.618 Fibonacci extension level at 58.85. The significance of the latter is confirmed by the fact that it is currently converging with the 100-day MA (in blue).
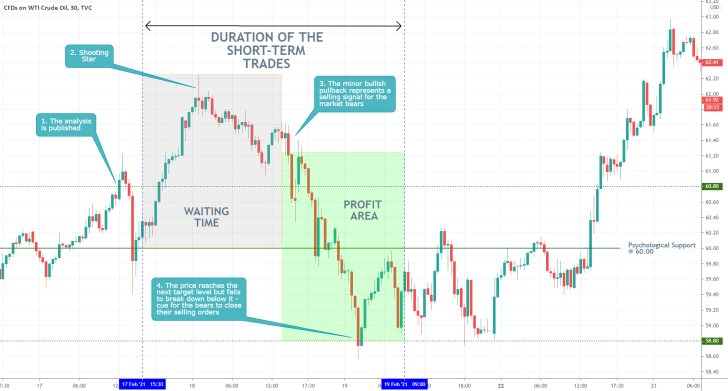
- The setup was more favourable to the bears than the bulls. Following the initial upswing, the price action changed directions, thereby allowing the bears to sell the price of crude. The price action subsequently reached one of the expected targets - the support at 58.80, which resulted in a near 4% profit.
- The biggest takeaway to remember is that whenever the market is being driven by external factors, such as extremely cold weather, the price action is prone to display erratic behaviour, changing directions abruptly. Under such volatile conditions, less risk-averse traders should apply tighter SLs and monitor the price action as it nears crucial supports and resistances.
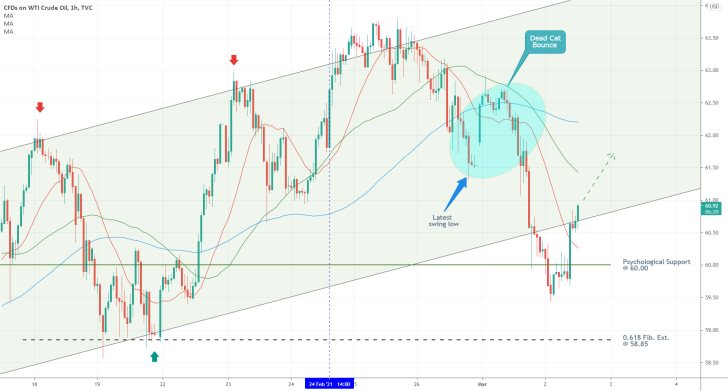
- Crude oil rebounded from the psychological support level at 60.00, representing a significant piece of evidence for the market bulls, that the bullish correction is now likely to be extended higher.
- Moreover, the price action also managed to break out above the 20-day MA (in red), which represents a floating resistance and get back within the boundaries of the ascending channel.
- Unless it changes directions immediately, crude is likely to attempt breaking above the latest swing low (lowest part of the Dead Cat Bounce) next before continuing to probe higher towards the upper boundary of the channel.
- Bulls can look for an opportunity to buy into the uptrend around the current market price, however, they should be cautious of adverse fluctuations. The price could drop to the psychological support once more before the upswing is continued.
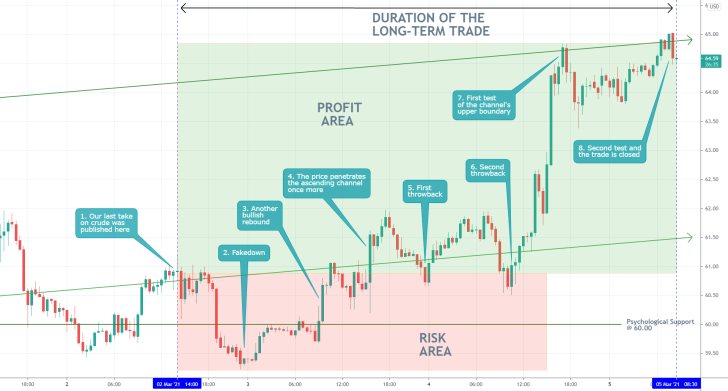
- Expectedly, the price of crude started appreciating after we posted our last journal entry on the commodity. However, it should be stated that before doing so, the price established a false breakdown (fakedown), which amounted to a $1.73 dropdown.
- That is why traders should be especially careful when trading on rebounds from psychologically significant supports and resistances. More often than not, the price would fluctuate in range for a bit before the reversal is completed.
Disclaimer: Your capital is at risk! Trading and investing on the financial markets carries a significant risk of loss. Each material, shown on this website, is provided for educational purposes only. A perfect, 100% accurate method of analysis does not exist. If you make a decision to trade or invest, based on the information from this website, you will be doing it at your own risk. Under no circumstances is Trendsharks responsible for any capital losses or damages you might suffer, while using the company’s products and services. For more information read our Terms & Conditions and Risk Disclaimer.


