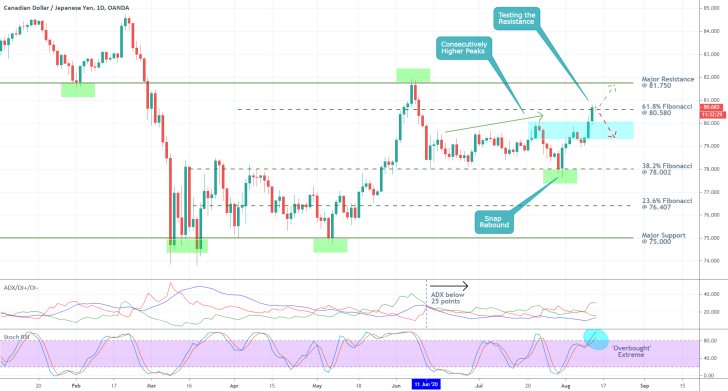
The CADJPY has advanced by more than 3.5 per cent since the beginning of August, and the peak of this bullish run was reached yesterday when the pair tested the strength of a psychologically important Fibonacci retracement level. Similarly to the last time the pair traded around a prominent level, the price action is once again quite likely to rebound and establish at least a minor correction.
As it's about to be seen, there is a confluence of underlying evidence signalling that the market is ready to 'take a break' from developing the recent upswing and retrace back. Today's analysis examines the opportunities for swing trading from the currently emerging peak of the uptrend, as well as longer-term position trading opportunities for riding the broader trend.
It should be, however, stated that the prevailing market sentiment is ostensibly range-trading, which means that the bulls should be aware of the fact that the currently developing uptrend is going to (potentially) emerge from a current range. What this environment entails are heightened volatility, prospects for erratic fluctuations around crucial levels of support and resistance, and sudden reversals.
In other words, the bears can exploit the contrarian trading opportunities in the short-term. In contrast, the bulls should continue monitoring the underlying sentiment and keep an eye for signals that the market is indeed transitioning from trading in a range to trending.
1. Long-Term Outlook:
The CADJPY is, for the time being, range-trading in a large consolidation area that spans between the 38.2 per cent Fibonacci retracement level at 78.002 and the 61.8 per cent Fibonacci retracement level at 80.580. As can be seen on the daily chart below, the aforementioned rebound occurred from the latter, and that is what gives credence to the expectations for a new bounce back now that the pair is trading near the latter.
The expectations of the bears for the establishment of a correction in the short-term and the anticipations of the bears for the development of a new uptrend in the longer-term are not mutually exclusive. A minor bearish correction now is to be expected given the range-trading conditions, but at the same time, it could serve the role of a transitionary stage as the market attempts to form a new uptrend.
In other words, the market could retrace back towards one of the three previous peaks, while the longer-term target after a decisive breakout remains the major resistance level at 81.750.

As regards the expectations for the formation of a bearish correction in the short-term, the current reading of the ADX indicator can substantiate them. The indicator has been threading below the 25-point benchmark since the 11th of June, which underscores the robust range-trading sentiment in the market. Consequently, the underlying conditions are ideal for rebounds from psychologically-important support and resistance levels, and the range's upper boundary at 80.580 is just that.
Additionally, the Stochastic RSI indicator has recently entered into its 'Overbought' extreme, which is very likely to compel the bears to start placing more selling orders given the aforementioned range-trading conditions. That is so because contrarian trading is more prevalent when the market remains flat and without an easily recognisable direction.
2. Short-Term Outlook:
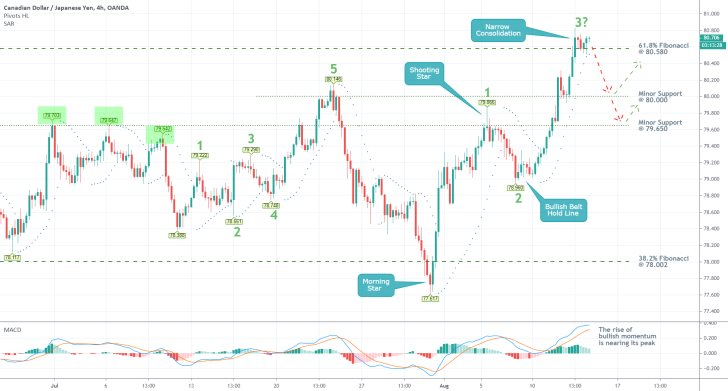
As can be seen on the 4H chart below, the direction of the market is more clearly visible on charts with smaller timeframes. Despite the broader range-trading conditions, the price action is not completely devoid of clearly defined swings. That is why the Elliott Wave Theory can be applied to study the nature and potential direction of these swings.
After the latest rebound from the 38.2 per cent Fibonacci, which commenced with a morning star pattern, the price action went on to establish one swing high at 79.866 and one swing low at 78.960. These two can be perceived as the initial stages in the development of a broader 1-5 impulse wave pattern.
The 1-2 leg is the first retracement of the broader pattern, and the subsequent 2-3 leg represents the second impulse. Given the aforementioned reasons justifying the expectations for a rebound from the 61.8 per cent Fibonacci, the market could have already established a new peak at point 3. If this is indeed true, then the market would be ready to develop a new retracement leg (3-4). The narrowing Parabolic SAR indicator confirms this assertion.

There are two contending levels on which a bottom (point 4) could be reached. Those include the minor support level at 80.00, which has psychological significance, and the other minor support level at 79.650.
Nevertheless, it should also be noticed that the underlying momentum remains mostly bullish. This can be discerned from the MACD indicator. A possible crossover between the faster 12-day EMA with the slower 26-day EMA would underpin a change in the direction of the momentum, and confirm the expectations for a new correction.
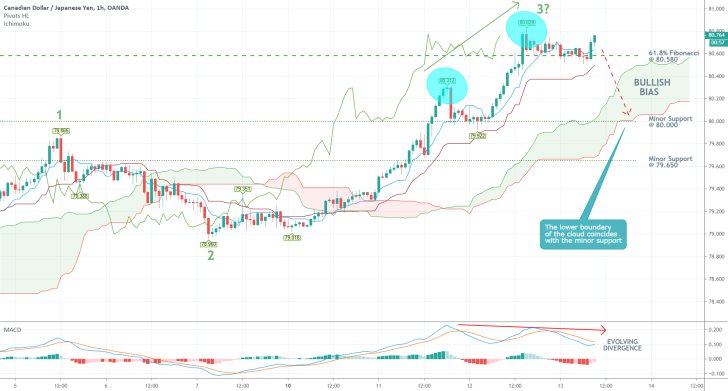
Finally, there is a clearly visible divergence on the hourly chart below. While the price action has been able to establish consecutively higher peaks at 80.312 and 80.828 respectively, the waves of the MACD have not risen with the same pace. This divergence entails waning bullish momentum and is a suitable prerequisite for the emergence of a new bearish correction.
At the same time, the Ichimoku Cloud indicator continues to demonstrate the persistence of bullish bias, which does not preclude the possibility for the emergence of a new correction. The price action could fall to the bottom of the cloud, which notably coincides with the psychologically important minor support at 80.00 before the bulls take back control.

3. Concluding Remarks:
The CADJPY continues to be range-trading, which should be considered by bulls and bears alike before either of them places any orders. There is a strong bullish commitment at present; However, it remains to be seen whether it would be enough to keep the price action concentrated above the range's upper boundary, which is represented by the 61.8 per cent Fibonacci. Meanwhile, the timing seems right for the establishment of a minor bearish correction.
Disclaimer: Your capital is at risk! Trading and investing on the financial markets carries a significant risk of loss. Each material, shown on this website, is provided for educational purposes only. A perfect, 100% accurate method of analysis does not exist. If you make a decision to trade or invest, based on the information from this website, you will be doing it at your own risk. Under no circumstances is Trendsharks responsible for any capital losses or damages you might suffer, while using the company’s products and services. For more information read our Terms & Conditions and Risk Disclaimer.


