The EURUSD has recently completed the formation of a Head and Shoulders pattern on the daily chart, and the currency pair's price is currently testing the strength of a major support level. This setup creates an advantageous trading opportunity, as traders have a chance to enter the market at this crucial point in time. The current economic climate also creates perfect conditions on the market for the establishment of significant price swings given the solid quarterly performance of the companies in the Tech industry earnings wise; the interest rate decision in the US; the Brexit deadline, which is tomorrow, and more. Therefore, the purpose of this analysis is to examine the short-term trading opportunities on the EURUSD in light of those recent developments fuelling the volatility on the market presently.
1. The General Outlook on the Currency Pair:
Even though the EURUSD seems to be consolidating within the boundaries of a narrow range, as indicated on the weekly chart below, the two respective currencies are seemingly going through entirely different episodes. On the one hand, the EU is currently dealing with profound structural changes that are going on with its organisation, as the official Brexit deadline is set for tomorrow, and Britain will finally leave the bloc. Its departure would undoubtedly leave a lot of unanswered questions regarding the futures of both the EU and also the UK. These resulting uncertainties of both economic and political nature have the capacities to alter the political landscape in Europe, which is weighing down heavily on the central currency. The EUR has been pressured by Brexit uncertainty and also sluggish economic growth, which, in turn, has been created by impeded international trade and distortions in the global supply network.
The US economy, on the other hand, has been going through a patch of heightened inflationary pressures, which have spurred the stabilisation of prices in the country. Additionally, robust jobs gains have caused the labour market to stay on historically low unemployment for over a fiscal quarter and still going. The slump in global trade, which has had a curbing effect on the European economy, has benefited the dollar, as international investors were betting on the greenback to come on top in the US/China trade war. Trump's protectionist foreign policies have benefited the strengthening of US assets; however, they have arguably damaged international markets even more so.
Consequently, the EURUSD is presently on its fifth consecutive week of generating losses, driven by the aforementioned disparity in the underlying pressures that are affecting the two respective currencies. And while the euro is losing ground to the dollar, the pair is still trading within the boundaries of a more significant overall range. The EURUSD has fallen to its lower border at 1.10100, and the question is whether the price of the pair would manage to break down below it and extend the development of the current bearish trend, or if it would manage to establish a new bullish correction?
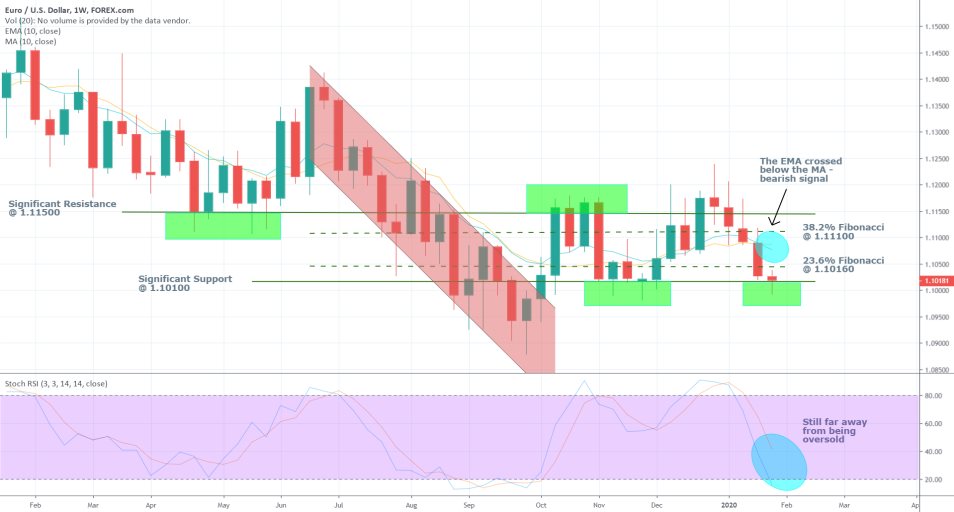
The price is currently consolidating between the 23.6 per cent Fibonacci retracement level at 1.10160 and the aforementioned significant support level at 1.10100, as illustrated on the weekly chart above.
So far, the bearish price action is being held back by the support, which has already been tested six times in the past, and it shows no signs of collapsing. At the same time, however, the RSI indicates that there is still room for the overall demand to fall before the currency pair becomes ostensibly 'oversold', which means that the bearish downswing has the capacity to continue advancing further. This notion is also confirmed by the 10-Day EMA and the 10-day MA, whose bearish convergence is supporting the bearish momentum.
2. FED’s January Decision and the Short-Term Outlook of the Pair:
The FOMC expectedly decided to leave the interest rate unchanged at 1.75 per cent during its monetary policy meeting yesterday. In its post-decision statement, it was conferred that:
“Although household spending has been rising at a moderate pace, business fixed investment and exports remain weak. On a 12 month basis, overall inflation and inflation for items other than food and energy are running below 2 percent. Market-based measures of inflation compensation remain low; surveybased measures of longer-term inflation expectations are little changed.”
Overall, the Committee commented on the strong sides of the American economy; however, it also acknowledged the areas, which are still either underperforming or hurting from external pressures. They expressed concerns that there is still spare capacity for improving the inflationary pressures. Additionally, the FOMC reflected on the areas of the economy, which are growing at a moderate pace. Thereby, the Committee did not sound as optimistic as some might have anticipated despite the overall stable performance. Even though the Committee members did not sound exceptionally dovish in their remarks, it is evident that there is still work to be done as regards stimulating factors such as household spending and business fixed investment.
From the somewhat muffled down tone of the statement, it became clear that the reeling American economy is still not as resilient as many analysts and economists would like it to be. Thus, the robust performance of the dollar could now be put to the test as room for a short-term bearish correction is now being left in the wake of the monetary policy decision. This means that the recent downswing on the EURUSD could be momentarily put on hold, as the euro has the chance to bounce back against the greenback. Given that the price is currently trading on the aforementioned significant support level, it seems very plausible that a momentary bullish correction to the last resistance level could now form.
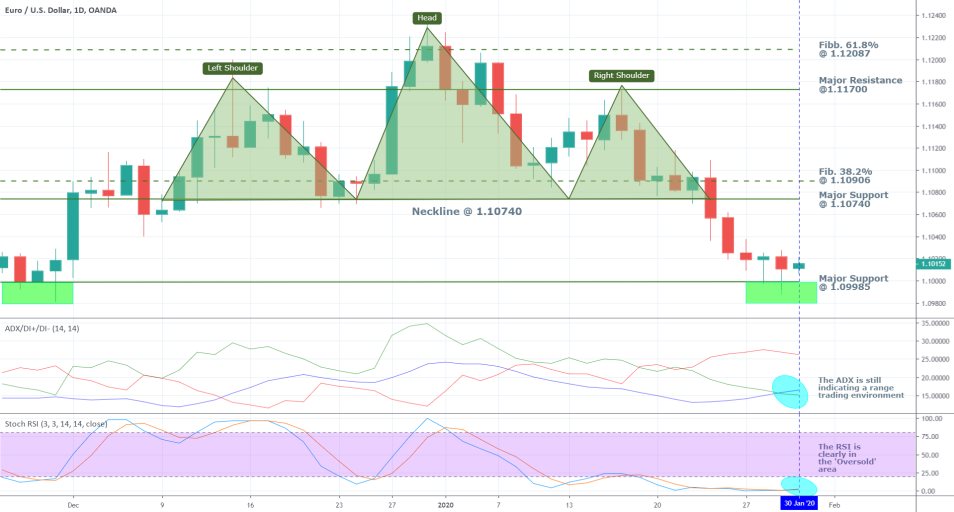
From the daily price chart above, it becomes clear that the price has recently broken down below the neckline of the head and shoulders pattern, which is a classic bearish formation. Regardless, the small bodies of the last few candles on the chart indicate diminishing commitment in the market, which could potentially lead to the creation of a new correction because it is occurring as the price nears the support level.
The Average Directional Index (ADX) is demonstrating that the price is currently trading in a range environment as it (the blue line) is below 25. Ranges are typically known for creating the perfect conditions for the formation of price reversals at pivotal levels, such as the support at 1.09985. That is why stochastic indicators are preferable in range environments, as they are best fitted to detect the swiftly changing market sentiment at such turning points.
The 1D RSI is clearly in the 'Oversold' area, which does not necessarily mean that the direction of the market would turn right away. However, if traders see an opportunity for a reversal of the price's direction when the RSI is positioned in one of its two extremes, it could cause a sudden change of the overall demand. In other words, an 'Oversold' RSI does not necessarily indicate a price reversal by its own margin, yet, under the current conditions, it is likely to compel traders to act on it and thereby create a reversal in the price's direction as a consequence.
All of these indications could support the execution of a long position on the EURUSD, which would be aimed to catch an anticipated bullish correction.
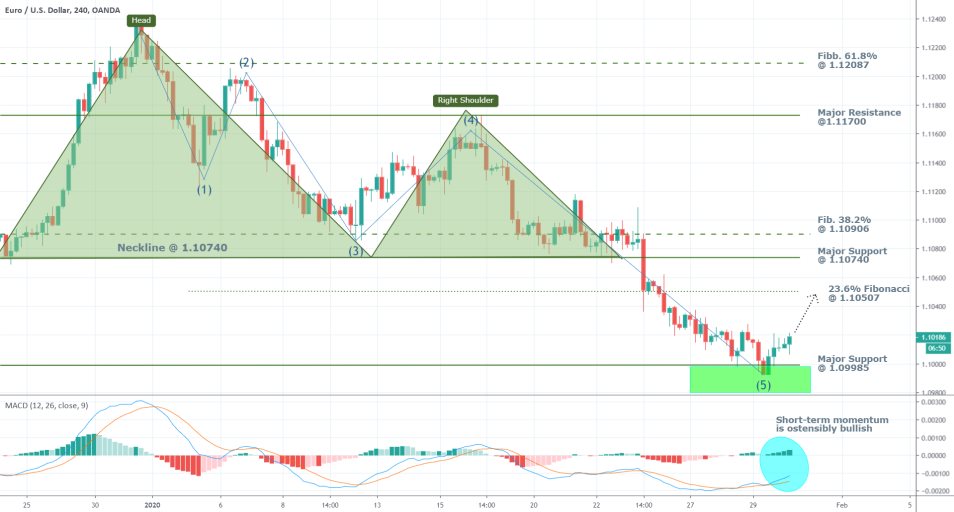
The 4H price chart above illustrates five impulses comprising a classic Elliott Wave Pattern, which seems to have exhausted itself just on the aforementioned major support level at 1.09985. Thus, the formation of a corrective ABC retracement pattern may now be due. This expectation is further supported by the psychological importance of the 1.10000 level (very close to the market price) – around such psychologically important price levels the underlying price tends to change its direction. Finally, the MACD exemplifies the short-term bullish momentum, which appears to be picking up steam – another bullish cue. Overall, if an ABC corrective swing were to form, the most likely targets would be the 23.6 per cent Fibonacci retracement level at 1.10507 and the major support at 1.10740 (the neckline of the head and shoulders pattern).
3. Constructing a Trade on the Current Setup:
The following hourly chart exhibits the potential entry levels and target levels that can be used for the execution of such a trade.
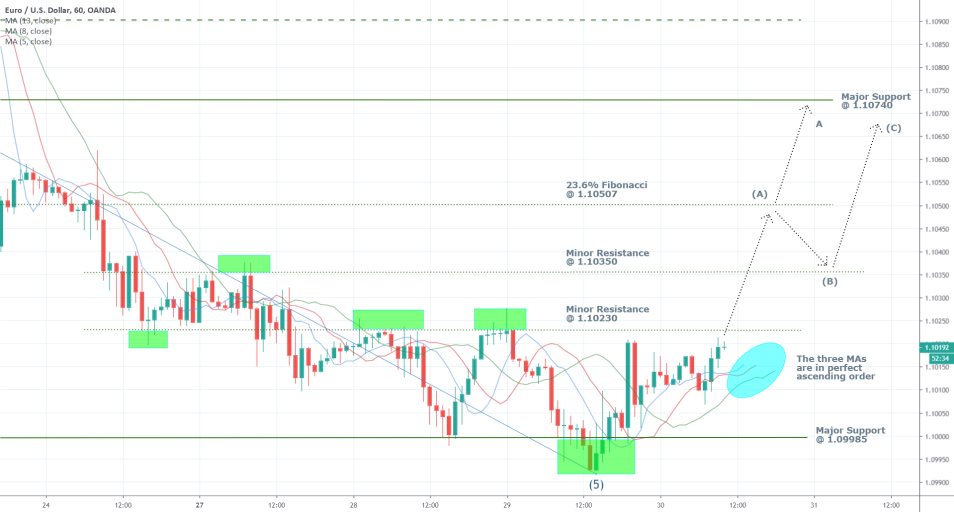
Scenario 1 – Placing a Long Order on the Market Price.
Entry Level – a long position can be opened around the current market price of 1.10200
Stop-loss – should be placed just below the most recent dip at 1.09910
Target Level - either the resistance at 1.10507 or the resistance at 1.10740
Scenario 2 – Placing a Short Trade. This should be done only if the market fails to form a bullish correction, and the price continues to develop the bearish swing.
Entry Level - Should be placed just below the most recent dip at 1.09910
Stop-loss – just above the major support level around 1.10050
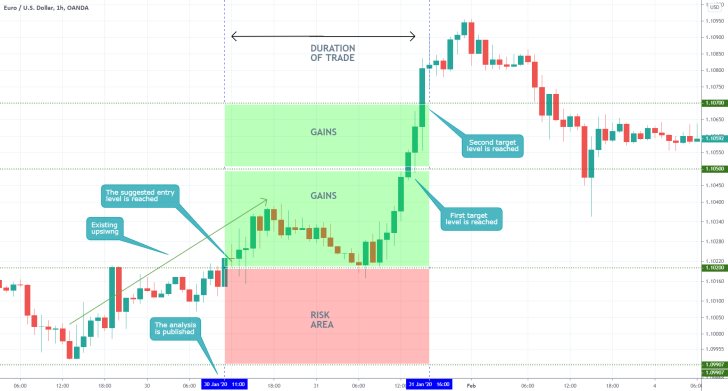
- Overall, successful trade. Made 50 pips in profit. However, the long order was executed in an existing upswing, which is undesirable. Also, the stop-loss was too large. More profits could have been made if the stop-loss had been substituted with a floating stop-loss (20-30 pips away from the recent high) after the market had already moved 20-30 pips in the desired direction. The biggest takeaway from this trade is that it is better to join existing trends when the market is establishing a correction, as opposed to entering while the price is already moving in the direction of the trend.
Disclaimer: Your capital is at risk! Trading and investing on the financial markets carries a significant risk of loss. Each material, shown on this website, is provided for educational purposes only. A perfect, 100% accurate method of analysis does not exist. If you make a decision to trade or invest, based on the information from this website, you will be doing it at your own risk. Under no circumstances is Trendsharks responsible for any capital losses or damages you might suffer, while using the company’s products and services. For more information read our Terms & Conditions and Risk Disclaimer.


