FED Chair Jerome Powell's speech at the Jackson Hole Symposium last week jolted the U.S. dollar as he cautioned against premature policy intervention. This exacerbated the greenback's woes in the short term and prompted a sizable upswing on the price action of the EURUSD.
Even still, there is light at the end of the tunnel for EURUSD bears. The Bureau of Labour Statistics (BLS) in the U.S. is scheduled to post the August non-farm payrolls on Friday, which could be the boost that the greenback needs to start rallying once again. This is so because of the forecasts for another robust employment report.
Meanwhile, the market has already priced in the recent inflation numbers in the Eurozone, which means that the bullish momentum of the euro is starting to depreciate.
All of this implies that another bearish reversal on the price of the EURUSD pair may be already in the making, which means that bears could look for an opportunity to utilise contrarian trading strategies. However, the underlying upswing is not yet completely concluded, and bulls may yet squeeze something out of it.
The manner in which the underlying trading setup can be taken advantage of boils down to the preferred timescale of the two types of traders.
Multiple Resistances Converging
The aforementioned upswing began following a failed breakdown below the last swing low (at 1.17000), as can be seen on the daily chart below. However, the underlying sentiment remains ostensibly bearish. This is asserted given that the price action remains concentrated within the boundaries of a descending channel.
It follows that the upswing itself could be a minor retracement within the broader downtrend. This claim is substantiated by the fact that this was the first test of the 1.17000 support in several months. Such prominent thresholds typically take several attempts by the price action before they get broken decisively.
In other words, once the underlying upswing is exhausted and the price reverses yet again, it would have another chance to probe the 1.17000 support. And there are several reasons to expect that the upswing is coming very close to completion.
Yesterday's price action established a Shooting Star candle, which typically indicates potential bearish reversals. It did so at the 23.6 per cent Fibonacci retracement level at 1.18045, while it is being crossed by the upper boundary of the descending channel and the 50-day MA (in green).
The development of a Shooting Star candle just as several resistances of significant importance are converging indicates a very high probability of a subsequent reversal. In other words, the upswing may have already climaxed around 1.18045.
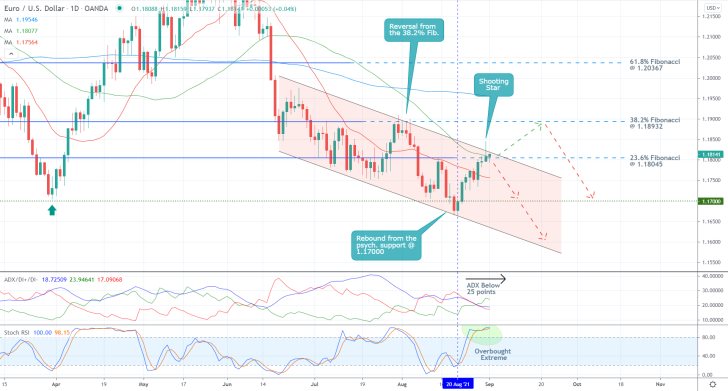
The ADX indicator crossed below the 25-point benchmark on the 20th of August, which means that the market is range-trading in the short term. While this gives some credence to the expectations for the eventual development of a new uptrend, the reading of the ADX should be examined in conjunction with the reading of the Stochastic RSI.
The latter has recently entered into its overbought extreme, which, given the prevailing range-trading sentiment in the short term, is more likely to prompt another reversal from the closest resistance.
Hence, if the price action does indeed reverse from the 23.6 per cent Fibonacci over the next several days, it is likely to head towards 1.17000 once again. Conversely, a potential breakout above the several converging resistances would signify rising bullish bias. If such a decisive breakout occurs next, the price action would then be able to head towards the 38.2 per cent Fibonacci at 1.18932.
How Far Can the Upswing Go?
Bulls and bears alike should take notice that the price action looks much more volatile and unpredictable on a chart with a smaller timescale, as shown on the 4H chart below. This means that more risk-averse traders would better sit and wait for more decisive signals of a potential reversal.
On the one hand, the upswing commenced following a breakout above the Wedge pattern, which underpins mounting bullish bias. This means that the upswing is likely to continue heading north. However, the underlying bullish momentum may have already peaked, as underscored by the MACD indicator.
Such conflicting readings are to be expected ahead of an upcoming reversal. Unfortunately, they imply that the price action is likely to become even more erratic and unpredictable as its general direction is being changed. This is likely to result in adverse fluctuations that could hit poorly placed stop-losses.
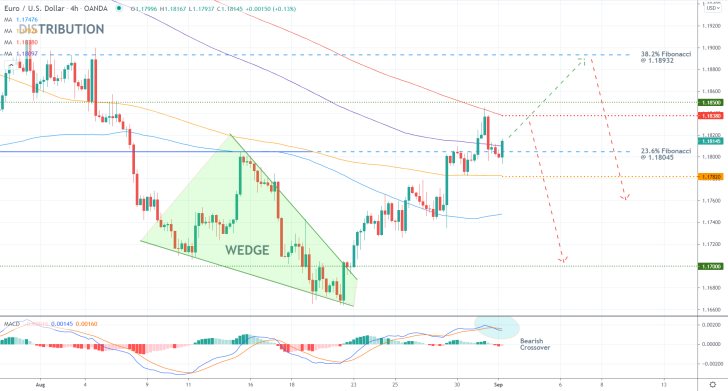
The biggest test for the underlying bullish commitment is encapsulated by the minor resistance at 1.18380, highlighted by the 350-day MA (in red). The price action would be ready to test the 38.2 per cent Fibonacci only on the condition that it manages to penetrate above 1.18380 decisively.
In contrast, an immediate reversal from the 23.6 per cent Fibonacci and a subsequent breakdown below 1.17820 (underpinned by the 200-day MA in orange) would confirm the prevalence of selling pressure in the short term.
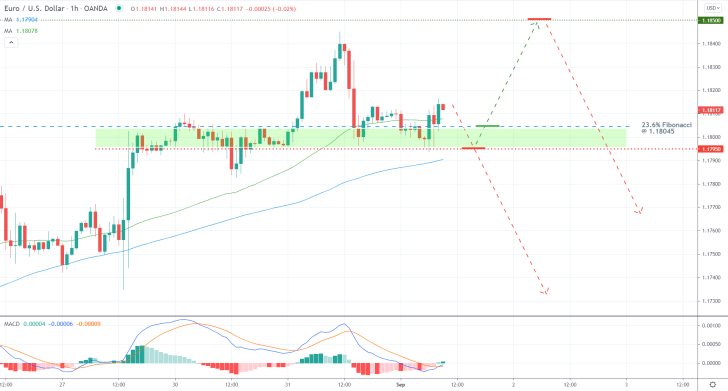
The hourly chart below demonstrates the manner in which the upswing could be extended towards the next resistance or be terminated entirely. It boils down to how the price action would behave around the make-it-or-break-it area (in green) next. Its upper boundary is signified by the 23.6 per cent Fibonacci and the 50-day MA (in green), whereas its lower limit is underpinned by the 100-day MA (in blue).
Notice also that the MACD indicator is currently threading around the neutral 0.00 level. This means that the underlying momentum is completely neutral in the very short term.
Concluding Remarks
Bulls who decide to enter around the current market price should keep in mind that this would entail a very high degree of risk. That is why they shouldn't place their stop-loss orders below 1.17950. Once the price action reaches 1.18500, they can substitute their fixed stop orders for floating TPs.
Bears, in contrast, can consider entering short on the condition that the price action penetrates below the 23.6 per cent Fibonacci decisively. They shouldn't place their stop-loss orders more than 40 pips away from the initial entry. As stated earlier, the next target for the renewed downtrend would be the 1.17000 support level.
EURUSD to Break the Ascending Channel
The euro started depreciating during today's trading session, ahead of the policy meeting of the ECB on Thursday. The Monetary Policy Committee (MPC) of the Bank, with Chair Christine Lagarde, is expected to keep the 0.00 per cent Main Refinancing Rate unchanged.
The Committee is also likely to adopt a slightly more dovish-sounding rhetoric, similarly to their colleagues from the Governing Council of the RBA from earlier today. This is owing to the expectations for stymied economic activity in the third quarter because of the Delta variant.
Given the bolstered likelihood of a U.S. dollar recovery in the near future, the time seems suitable for the implementation of contrarian trading strategies by EURUSD bears.
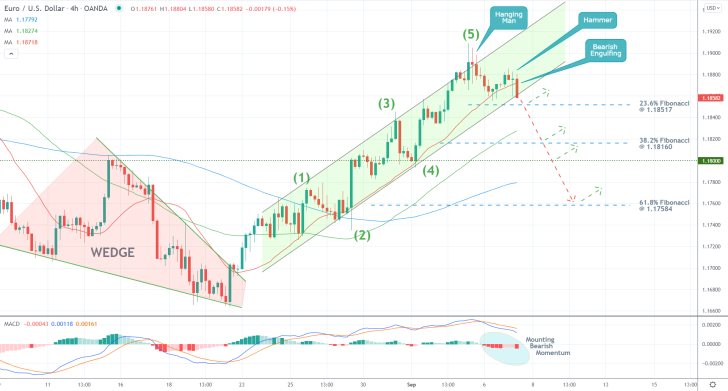
As can be seen on the 4H chart above, the latest upswing is contained within the boundaries of an ascending channel. It was commenced following the completion of the last Descending Wedge. Moreover, the upswing itself took the shape of a 1-5 impulse wave pattern, as postulated by the Elliott Wave Theory.
Given that the pattern seems to be completed, the probability of a subsequent reversal seems higher. But there are other observable indications that are congruent with the underlying bearish expectations.
The highest candlestick at the peak of the 1-5 pattern takes the form of a Hanging Man, which is a classic candle indicating a likely reversal. Shortly afterwards, a Hammer emerged too, which signifies the same thing.
The presently developing Bearish Engulfing candle is, for the time being, penetrating below the 20-day MA (in red) - it remains to be seen whether it would close below it, too. The latter serves as the closest floating support to the current price action. Also, the price action is set to test the lower limit of the ascending channel and the 23.6 per cent Fibonacci retracement level at 1.18517.
If it breaks the three, the next target for the dropdown would be the 38.2 per cent Fibonacci at 1.18160. In addition to the fact that it was recently crossed by the 50-day MA (in green), the latter is also positioned quite close to the psychologically significant support level at 1.18000.
These two factors make the 38.2 per cent Fibonacci a prominent turning point. However, if there is sufficient bearish commitment in the market, the price action could even test the last Fibonacci threshold - the 61.8 per cent retracement level at 1.17584.
If the currently developing candle closes below the lower limit of the channel, or the price action manages to do so by the end of the session, bears can consider entering short around the spot price. As per usual, they should not place their stop-losses more than 30 pips away from their initial entry levels.
EURUSD Nearing the End of the Pullback
The price action of the EURUSD is developing a new downtrend. However, it created a minor pullback over the last several hours, which would soon be completed. This would allow bears to execute trend continuation strategies by selling at the resulting peak. The idea is to gain a favourable entry before the broader downtrend is resumed.
The Bureau of Labour Statistics (BLS) is scheduled to publish the latest inflation numbers in the U.S. in several hours, which would likely strengthen the greenback. This economic release could therefore serve as the likely catalyst for such a bearish reversal.
Meanwhile, the euro is likely to continue depreciating against other major currencies as well, which substantiates the primary expectations of this follow-up analysis. That is why bears should start looking for an opportunity to enter short in the near future.
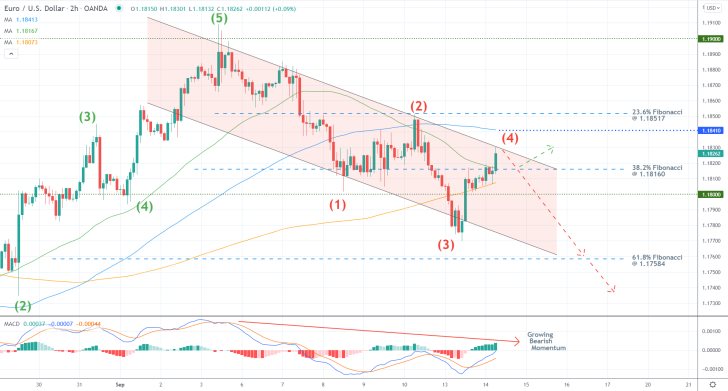
As can be seen on the 2H chart above, the new downtrend is encompassed within the boundaries of a massive descending channel. The price action is currently probing its upper limit for the fourth time, where the reversal is likely to occur.
The preceding uptrend took the form of a 1-5 impulse wave pattern, as postulated by the Elliott Wave Theory. Judging by the behaviour of the price action over the last several days, the new downtrend is likely to have a similar structure as well.
The current pullback thus seems to serve as the second retracement leg (3-4) of the new bearish 1-5 impulse pattern. This observation corroborates the expectations of another reversal from the upper boundary of the channel.
However, bears should be cautious. The price action strengthened above the 200-day MA (in orange) before breaking out above the 38.2 per cent Fibonacci retracement level at 1.18160 and the 50-day MA (in green). This is demonstrative of strong bullish pressure in the very short term.
Bears looking to sell around the current spot price should be mindful of potential adverse fluctuations to the 100-day MA (in blue), which currently underpins the major resistance level at 1.18410. That is why they would have to place stop-loss orders that are at least 30 pips above their initial entries but not more than 40 pips away.
The first target for the renewed downtrend is the 61.8 per cent Fibonacci at 1.17584 before the price can continue sinking lower towards the next target (as suggested in the original analysis).
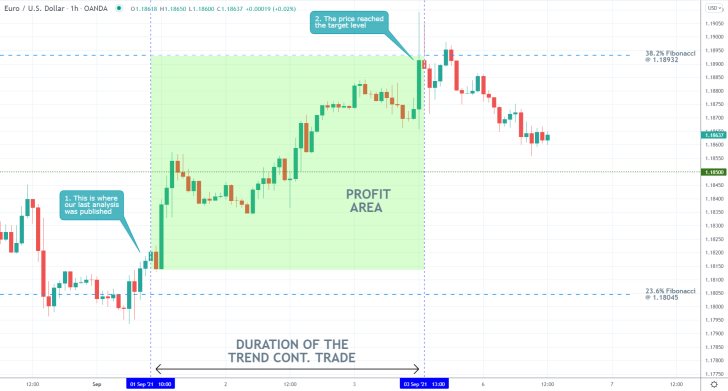
- Shortly after the publication of our last EURUSD analysis, the price action started appreciating, as forecasted. There were no adverse fluctuations to the 23.6 per cent Fibonacci retracement level at 1.18045, which is why no short positions were opened.
- The price action reached the 38.2 per cent Fibonacci at 1.18932, which was the target level. Afterwards, it went on to consolidate below this major resistance level for a while, which underpinned the changing market bias at that time and the termination of the selling opportunity.
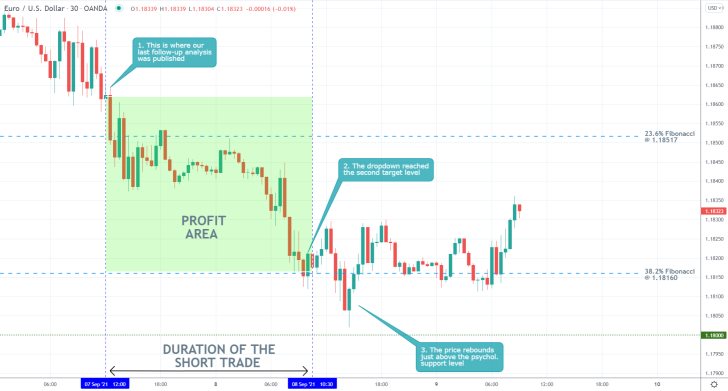
- Shortly after the release of our last EURUSD follow-up analysis, the price action started depreciating, as forecasted. At one point, it had broken down below the 38.2 per cent Fibonacci retracement level at 1.18160 but rebounded just above the psychologically significant support level at 1.18000.
- The price action is currently establishing a minor bullish pullback, though it remains to be seen whether the broader bearish sentiment would persist.
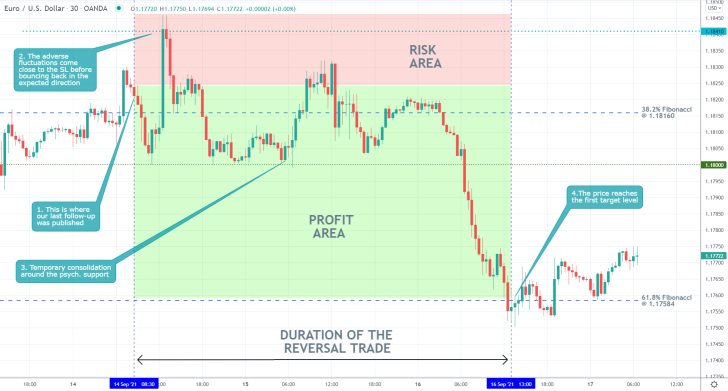
- Our last follow-up analysis of EURUSD successfully forecasted a dropdown to the 61.8 per cent Fibonacci retracement level at 1.17584 from the 38.2 per cent Fibonacci at 1.18160. The initial adverse fluctuations were no bigger than 20 pips, which is below the SL level.
- Presently, the price action appears to be developing a minor pullback before the broader downtrend can be resumed.
Disclaimer: Your capital is at risk! Trading and investing on the financial markets carries a significant risk of loss. Each material, shown on this website, is provided for educational purposes only. A perfect, 100% accurate method of analysis does not exist. If you make a decision to trade or invest, based on the information from this website, you will be doing it at your own risk. Under no circumstances is Trendsharks responsible for any capital losses or damages you might suffer, while using the company’s products and services. For more information read our Terms & Conditions and Risk Disclaimer.


