The USDJPY has been range-trading since mid-April, and the pair continues to be consolidating within the same narrow area that was established in the wake of the initial coronavirus crash. The underlying market sentiment is suitable for the implementation of swing trading strategies, as the price action continues to bounce between the two limits of the underlying range.
These conditions are likely to persist in the following days and weeks due to the evolving fundamental factors globally. The demand for safe-haven assets continues to be seesawing as the markets are constantly assessing the ever-changing risks to the global economic stability. The uncertainty stemming from the pandemic remains a major impediment for the ongoing recovery process. Consequently, the intermittently changing demand for the greenback and the yen is causing the USDJPY to fluctuate without developing a decisive trend in either direction.
The monetary policy decision of the Bank of Japan, which is scheduled for release tomorrow morning, coupled with the crucially important retail sales data from the US, is likely to preserve the underlying market sentiment that is currently driving USDJPY's price action.
That is why the purpose of today's analysis is to examine a presently developing retracement. The latter would establish a new intermediate peak, which would, in turn, allow the market bears to place short orders on the anticipation for a new dropdown towards the range's lower boundary.
1. Long-Term Outlook:
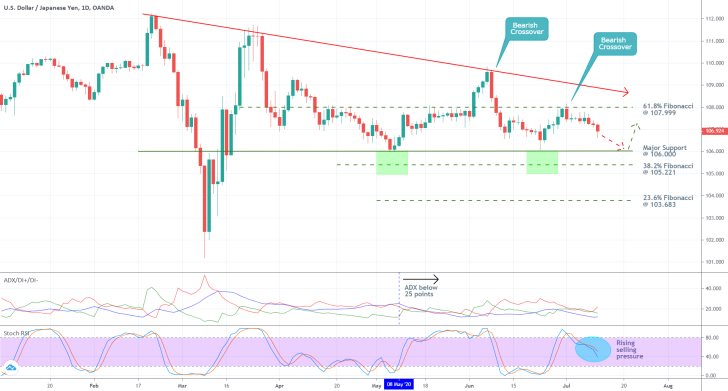
As can be seen on the daily chart below, the prevailing range spans between the 61.8 per cent Fibonacci retracement level at 107.999, and the major support level at 106.00. Additionally, the price action remains concentrated below the downwards sloping trend line, which has been tested on three separate occasions during the intense market tribulations that were brought abought at the outset of the coronavirus crash in mid-March. A breakout above the trend line seems highly improbable at present.
The ADX indicator has been threading below the 25-point benchmark since the 8th of May, which underscores the ostensibly range-trading environment that continues to set the tone for USDJPY's price action. For as long as the underlying market sentiment remains so subdued, the price action is likely to resume bouncing between the range's two boundaries.
The Stochastic RSI indicator underlines the rising bearish pressure in the market. Since the price action is currently trading in the middle of the range, a new dropdown towards the major support level at 106.00 can be anticipated.

2. Short-Term Outlook:
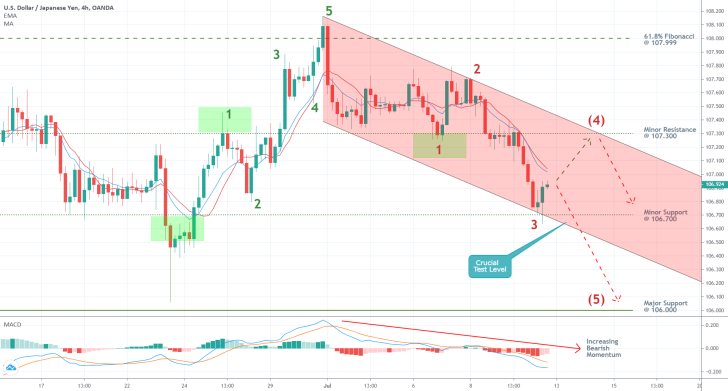
The expectations for the formation of a new swing low towards the major support level at 106.00 are substantiated by the behaviour of the price action in the short-term. As can be seen on the 4H chart below, the underlying price action is developing clearly defined swings, which is a behaviour that is typical for range-trading environments. Moreover, this type of market sentiment can be examined through the scope of the Elliott Wave Theory.
The last time the price action reached one of the range's two limits was when the previous bullish 1-5 impulse wave pattern reached its peak at point 5 (in green). Therefore, the current downswing can be perceived as a bearish 1-5 impulse wave pattern, which is headed towards the range's lower edge. It follows that the price action has recently established a new bottom at point 3 (in red) and that it is currently in the process of creating the aforementioned retracement (the 3-4 leg). Once a new peak is established at point (4), the market bears can sell the USDJPY on the expectations for the formation of the final impulse leg 4-5.
The peak at point (4) should be formed anywhere below the minor resistance level at 107.300, which marks the bottom of point 1 (in red). The same resistance level has recently converged with the downwards sloping channel's upper boundary, which represents yet another reason as to why the current retracement should be concluded below the 107.300 mark.
It should also be mentioned that the 10-day EMA (in blue) remains trading below the 10-day MA (in red), which confirms the prevalence of bearish momentum in the short-term. The MACD indicator also supports this observation.

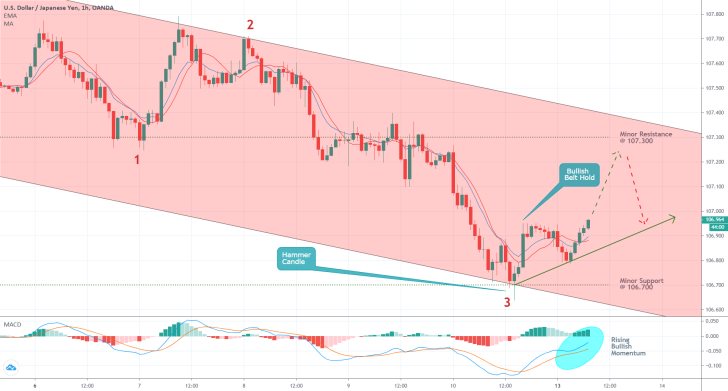
As can be seen on the hourly chart below, the underlying picture looks a bit more different on a shorter timescale. The price action rebounded from the channel's lower limit when the latter converged with the minor support level at 106.700. The resulting 'Hammer' candlestick signals the beginning of the aforementioned retracement (the currently developing 3-4 leg).
The rising bullish momentum in the short-term is confirmed not only by the MACD but also by the 10-day EMA (in blue) crossing above the 10-day MA (in red). This change of direction was prompted by the establishment of the bullish belt hold line.
Overall, the retracement is likely to continue advancing further north in the foreseeable future, until the underlying bullish commitment is completely exhausted. As was mentioned earlier, this could happen anywhere below the minor resistance level at 107.300. In other words, market bears should be looking for signals in the behaviour of the underlying price action pointing to a trend reversal. Once the retracement is decidedly concluded, the opening of short orders would be justified.

3. Concluding Remarks:
Traders should be cautious and wait for the termination of the current retracement before they join the market. Premature selling could expose them to the potential risk of a break out above the minor resistance level at 107.300. If this happens, then the bearish 1-5 impulse wave pattern would be invalidated, and the development of a downswing towards the major support level at 106.00 could be jeopardised.
In order for traders to successfully utilise swing trading strategies on the current market setup, they need to see clear bearish commitment in the underlying market sentiment before they rush to sell the USDJPY. This would depend on the manner in which the retracement is completed.

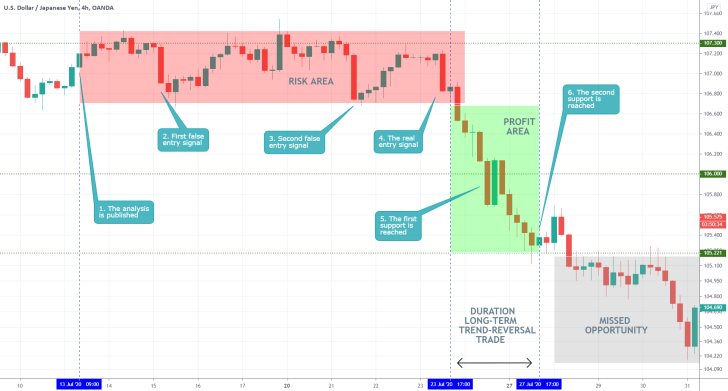
- The short-term projections of the analysis were very good, because they cautioned against protracted fluctuations around the 107.300 resistance level. The analysis also did an excellent job of cautioning traders against premature selling. As can be seen, the longer-term expectations were realised only after two false breakdowns were terminated. Only the most complacent and patient traders with a lot of mental stamina could wait for so long before the market moves in their favour, which is why traders need to poses these qualities in order to be consistently successful.
Disclaimer: Your capital is at risk! Trading and investing on the financial markets carries a significant risk of loss. Each material, shown on this website, is provided for educational purposes only. A perfect, 100% accurate method of analysis does not exist. If you make a decision to trade or invest, based on the information from this website, you will be doing it at your own risk. Under no circumstances is Trendsharks responsible for any capital losses or damages you might suffer, while using the company’s products and services. For more information read our Terms & Conditions and Risk Disclaimer.


