The price action of gold appears to be consolidating within the boundaries of a narrow range in the short term, even though bearish pressure continues to be increasing slowly but steadily. This could create a favourable setup for implementing trend continuation strategies by bears looking to sell the peak; however, such a scenario would be subject to several key developments.
The most significant determinant of the currently rising bearish pressure is the recuperating dollar. The greenback is expected to continue appreciating in the medium term, which, in turn, would likely have a negative impact on the commodity. Conventional wisdom dictates that the two have an inverse relationship, which is why safe havens are expected to decrease in value as global interest for the dollar ramps up.
Meanwhile, the temporary undecidedness of the market is prompted by the mixed economic numbers that were posted globally over the last several days. Consumption in the euro area grew at a slower pace than initially expected, while British construction fell to its lowest level since the beginning of the year. Both indicate the still tentative global demand being subdued by persisting supply squeezes.
The most significant catalyst for the next direction of the market would be the September non-farm payrolls in the U.S., which could blast the price of gold in either direction. According to the preliminary forecasts, the American labour market is projected to have added 490 thousand new jobs in September, nearly twice the amount from a month prior.
If realised, this would likely strengthen the greenback and jolt the price of gold. Yet, traders should better wait for the release of the report before they open any new positions (reactive trading) in order to avoid the adverse fluctuations that are likely to emerge around the time of its publication. The employment data is scheduled for publication tomorrow.
Between Two Fibonacci Thresholds
As can be seen on the daily chart below, the price action remains concentrated between the 38.2 per cent Fibonacci retracement level at 1771.78 and the 23.6 per cent Fibonacci at 1737.37. Additionally, the recent pullback from the lower limit of the range has reached the middle boundary of the Bollinger Bands (the 20-day MA in orange).
The price action has been consolidating below it since then, which is demonstrative of the strong selling pressure that exists just below the 38.2 per cent Fibonacci.
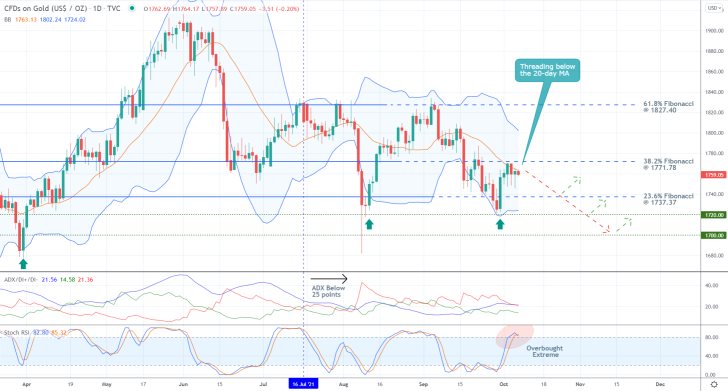
Notice that the Bollinger Bands have begun to level out (horizontally) over the last few days, indicating diminishing levels of adverse volatility and potentially the upcoming completion of the pullback. In other words, a reversal from the middle band would imply that the market is likely ready to resume heading further down south.
This assertion is further bolstered by the fact that the ADX indicator has been threading below the 25-point benchmark since the 16th of July, which underscores the range-trading environment that continues to exist. In addition, the Stochastic RSI has just entered into its overbought extreme. Both of these factors are congruent with the expectation for an eventual reversal from the 38.2 per cent Fibonacci.
The first target would naturally be the 23.6 per cent Fibonacci at 1737.37. If the price manages to break down below it, then it would likely head towards one of the two previous swing lows. Those are underpinned by the major support levels at 1720.00 and 1700.00, respectively. Keep in mind that the latter bears psychological importance. This is where a bullish rebound is most likely to occur once again.
Examining the Bullish Flag
Following the completion of the Descending Wedge pattern, which was accurately projected by our previous analysis of the commodity, the price of gold expectedly rebounded from the 23.6 per cent Fibonacci. This resulted in the establishment of the aforementioned pullback to the 38.2 per cent Fibonacci.
Presently, the price action is busy developing a new Flag, which typically serves as a trend continuation pattern. In other words, if the price manages to break out above the upper limit of the Flag decisively, this would likely lead to the extension of the uptrend past the 38.2 per cent Fibonacci. Conversely, a reversal from it could spell the completion of the pullback.
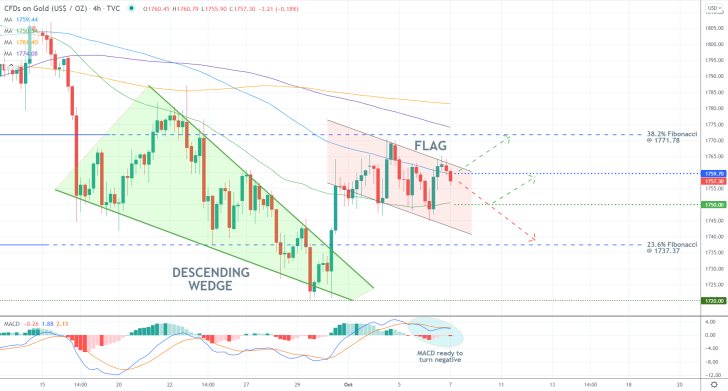
That is why the future behaviour of the price action around the moving averages would be crucial. Presently, the four moving averages have a perfect descending order - the 50-day MA (in green) is positioned below the 100-day MA (in blue), which is positioned below the 150-day MA (in purple), which is threading below the 200-day MA (in orange). This is demonstrative of the strong bearish bias in the market.
If the price manages to close above the 1759.70 resistance, underpinned by the 100-day MA, it could then head towards the 38.2 per cent Fibonacci yet again. Notice that it is about to be crossed by the 150-day MA, making it a more significant turning point. Conversely, a breakdown below the 1750.00 support, underpinned by the 50-day MA, could allow for future dropdowns towards the 23.6 per cent Fibonacci.
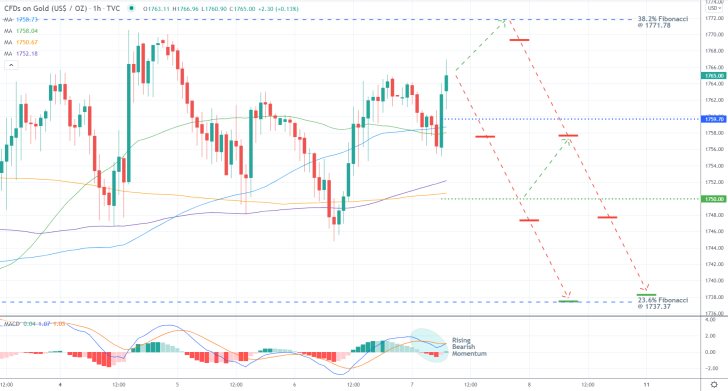
The significance of these two thresholds is further illustrated on the hourly chart below. Notice that both the 100-day MA and the 50-day MA are converging with the 1759.70 resistance, while the 150-day MA and the 200-day MA have just crossed the 1750.00 support. All of this is happening as the underlying bearish momentum is increasing, as demonstrated by the MACD indicator.
Concluding Remarks
Bears looking to join the market can do so in one of two ways. They can either wait for a reversal from the 38.2 per cent Fibonacci before they execute a short order, or they can sell the price of gold once it retraces back below 1759.70. Their stop-loss orders should not be placed more than $10 above their initial entries in both cases.
Bears can add to their selling orders once the price penetrates below 1750.00 decisively. Moreover, they would also be able to move their SLs to breakeven in order to protect themselves against sudden changes in the direction of the price action.
As stated earlier, the first major target for the downtrend is the 23.6 per cent Fibonacci retracement level at 1737.37.
The Price of Gold Continues to Trade in a Range
The price of gold has been consolidating within a narrow range since the beginning of October, and the range-trading environment looks poised to remain prevalent over the next several days as well. That is so due to the lack of any decisive market conviction in either direction, meaning that the underlying bias is neutral.
Under such conditions, traders can utilise range trading strategies. Those involve determining the two extremes of the range so that trades can be opened as the price nears either of them. Those trades would be executed with the intention of catching the reversals and rebounds from the borders of the range.
The underlying market sentiment mostly remains neutral due to diverging economic indications, pointing to an uneven global recovery. Headline unemployment has decreased in the U.S. and the UK in September, though the two labour markets have also added fewer jobs than initially expected.
On the other hand, economic sentiment in the Eurozone has sunk to its lowest level since the beginning of the coronavirus crash in early 2020, which attests to the bumpy and uneven stabilisation of the economies comprising the bloc. The highly anticipated U.S. inflation numbers for September, which are scheduled for publication later today, will provide further clarification of the latest economic developments.
Given these underlying fundamentals, traders should be careful not to enter the market at a time when the price of gold finds itself in the middle of the range. Instead, they should be patient and wait for it to draw near one of the range's two extremes before they place a trade on the expectations for a subsequent rebound or reversal.
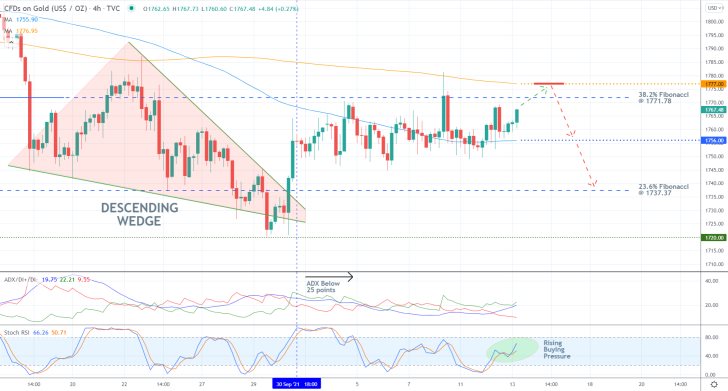
The consolidation range emerged after the price action rebounded from the previous swing low at 1720.00, as shown on the 4H chart above. This happened as the price action completed a major Descending Wedge, which confirms the completion of the previous downtrend.
Immediately following the breakout above the Wedge, the price action started to range trade. This is underpinned by the ADX indicator, which has been threading below the 25-point mark since the 30th of September. Meanwhile, the current reading of the Stochastic RSI indicator confirms that the underlying bias is currently neutral.
The range itself roughly spans between the 38.2 per cent Fibonacci retracement level at 1771.78 and the major support at 1756.00, underscored by the 100-day MA (in blue). Notice that the 200-day MA (in orange) is converging towards the upper limit of the range, making it an even more substantial turning point.
Therefore, bears can wait for the price action to reach the 1777.00 resistance before they place short orders. Their supporting stop-loss orders should not be placed more than 10 dollars above their initial entries. The first target is unsurprisingly the lower limit of the range at 1756.00, while the deeper target is represented by the 23.6 per cent Fibonacci at 1737.37.
Gold Climbing Towards the Next Psychological Resistance
The market continues to be driven by persisting supply squeezes, exacerbated by the global energy crisis. The end result is heightened volatility, especially in the commodities market, bolstered by increased uncertainty.
Given all of this extra unpredictability across different markets, the demand for gold has increased materially over the last several days. Gold, as the primary safe-haven asset, is desired by investors seeking to hedge their portfolios by increasing their holdings of lower-risk securities.
Additionally, this trend is likely to be bolstered by the crunching global activity and the expectations for yet another slump in Eurozone industrial activity.
Gold's price action has already started to appreciate, which is potentially going to lead to the establishment of a new bullish trend. Traders can take advantage of this setup by implementing trend continuation trading strategies.
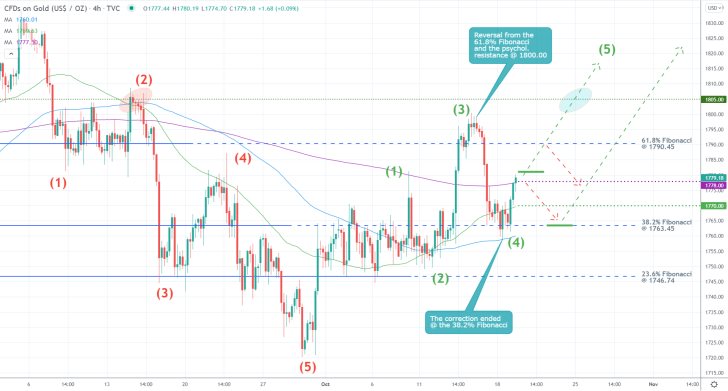
The currently unfolding uptrend started developing following the completion of the preceding bearish 1-5 impulse wave pattern, as postulated by the Elliott Wave Theory. The price action is likely to continue advancing in a similar manner, developing bullish impulse legs followed by bearish retracement legs in successive waves.
Notice that the second impulse leg (2-3) of the new bullish pattern was reversed from the psychologically significant resistance level at 1800.00. It was followed by the (3-4) retracement leg, which bottomed out at the 38.2 per cent Fibonacci retracement level at 1763.45. Currently, the price action appears to be establishing the (4-5) impulse leg, which bulls can try to join.
Notice that the price action is currently probing the make-it-or-break-it threshold at 1778.00, which is underpinned by the 300-day MA (in purple). If it manages to break it decisively, bulls would then be able to go long in anticipation of another upswing towards the psychologically significant resistance level at 1800.00.
However, they should be mindful of potential adverse fluctuations around the 61.8 per cent Fibonacci at 1790.45. Once the price action breaks out above the latter, bulls can substitute their fixed stop orders for floating TPs in order to squeeze the maximum out of the 4-5 impulse leg, should the price action manage to penetrate above 1800.00.
In terms of risk management, bulls who go long around the current spot price should utilise supporting stop-losses orders that are no more than $7 away from their initial entries.
The price action could conceivably drop to the 50-day MA (in green) before the upswing could be extended further north, which would provide bulls with the opportunity to go long at the next dip.
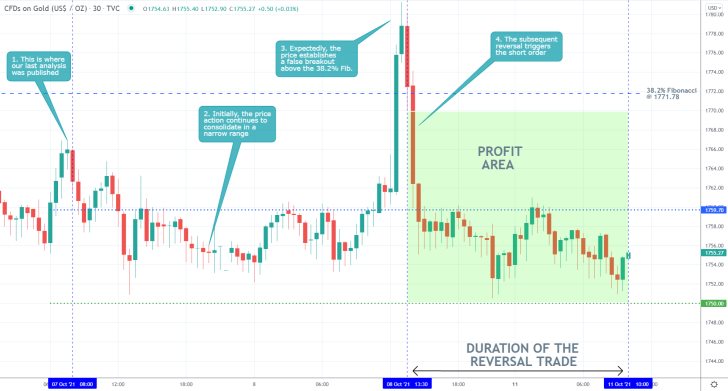
- Despite some initial horizontal price action, our previous analysis of gold successfully forecasted a bearish reversal from the 38.2 per cent Fibonacci retracement level at 1771.78.
- The underlying trade has generated a running profit, though bears should consider the possibility of another sharp bullish rebound. That is so because so far, the price action remains incapable of breaking down below the 1750.00 support level decisively.
- If the underlying consolidation range is not broken soon, the likelihood of additional adverse fluctuations occurring in the near future would be increased.
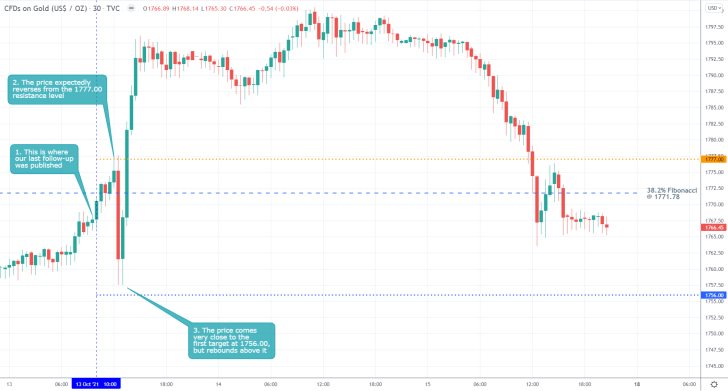
- The forecasts of our last gold analysis came very close to being realised. The upswing that was active at the time of the analysis' publication did reverse from the 1777.00 resistance level, which was an almost perfect prediction.
- Then, the price action almost reached the first target level at 1756.00 support level before the sudden rebound.
- This is a good example of why contrarians trading within an established range better implement floating stop orders in order to protect themselves against such sudden changes in the underlying direction of the price action.
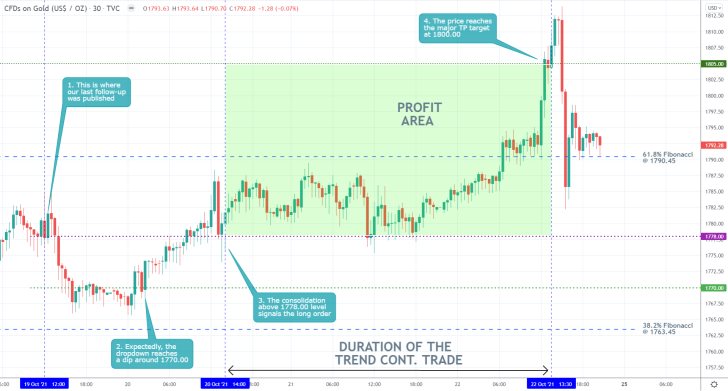
- The expectations of our last gold analysis were realised. Shortly after its release, the price action did drop down, though it rebounded marginally above the 38.2 per cent Fibonacci retracement level at 1763.45.
- The consolidation above the 1778.00 level signalled that the time was right for the execution of a long order. The following upswing expectedly reached the psychologically significant resistance level at 1800.00.
Disclaimer: Your capital is at risk! Trading and investing on the financial markets carries a significant risk of loss. Each material, shown on this website, is provided for educational purposes only. A perfect, 100% accurate method of analysis does not exist. If you make a decision to trade or invest, based on the information from this website, you will be doing it at your own risk. Under no circumstances is Trendsharks responsible for any capital losses or damages you might suffer, while using the company’s products and services. For more information read our Terms & Conditions and Risk Disclaimer.


