The GBPUSD has been trading within the boundaries of a narrowly defined range since the aftermath of the coronavirus crisis in late-March. The persisting uncertainty relating to the economic fallout from the pandemic coupled with the protracted Brexit negotiations have prompted the pair's seemingly directionless price action within the confinements of the range.
On the one hand, the pound was strengthened in the middle of last month when the BOE delivered on investors' expectations by maintaining its monetary policy inlined with the current economic developments. Even so, the longer-term trends are unfavourable for maintaining the pound's appreciation. During the previous quarter, the British economy registered its largest contraction on record, which poses significant risks for the value of the GBP.
On the other hand, the US dollar has been quite volatile over the past several days. The global demand for the greenback subsided partially as more and more investors start to weigh in on a robust economic recovery. However, the currency was not impacted by these developments quite as severely as one might have expected, because the continuous stock market rally has led to heightened optimism in the States. Consequently, these developments have invigorated the demand for the greenback - not as ca low-risk security, but as a means for wealth accumulation.
The fact that the dollar did not depreciate after the release of yesterday's dismal employment statistics is an attestation to the resilience of the greenback in the short-term, even as the total number of people who have claimed unemployment benefits since the beginning of the crisis exceeded 50 million.
With these fundamental factors in mind, the purpose of today's analysis is to outline the range-trading opportunities on the GBPUSD, as the pair is expected to rebound from the range's upper boundary.
1. Long-Term Outlook:
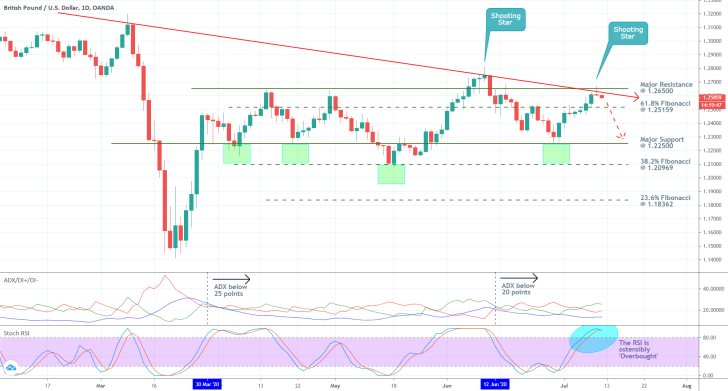
As can be seen on the daily chart below, the aforementioned range spans between the major resistance level at 1.26500 and the major support level at 1.22500. The price action reached the formed during yesterday's trading session but subsequently reverted itself. The resulting candlestick is of the 'Shooting Star' type, which entails rising bearish sentiment in the market. Moreover, it is usually found towards the upper end of a recent uptrend, and it signals a likely reversal.
The fact that a shooting star candle forms just below the downwards-sloping trend line for the second consecutive time that the price action reaches set trend line is what gives prominence to the main expectation for a trend reversal. These assertions are further bolstered by the fact that the trend line has crossed below the major resistance level at 1.26500, which further signifies the rising bearish sentiment in the market.
Overall, the observed behaviour of the price action around the two prominent turning points/lines comprises quite a compelling piece of evidence in support of the primary expectations. As can be seen, the first target level for the newly emerging downswing is encompassed by the 61.8 per cent Fibonacci Retracement level at 1.25159. Once the GBPUSD breaks down below it, the next target level would be the range's lower boundary – the major support level at 1.22500.

The ADX indicator has been threading below the 25-point benchmark since the 30th of March, which is roughly around the time when the global capital markets started to recover from the worst of the crash. Additionally, the indicator has been advancing below the 20-point mark since the 12th of June, which signifies the strengthening of the range-trading conditions. Under these circumstances, reversals in the underlying direction of the price action around the two edges of the range are to be expected.
Finally, the Stochastic RSI is currently showing that the market is clearly 'Overbought'. Given the aforementioned factors, the market bears are likely to seize the opportunity by placing short orders around the current market price, on the expectations for another reversal. Such actions, in turn, are going to bolster the selling pressure, and drive the underlying price action lower.
2. Short-Term Outlook:
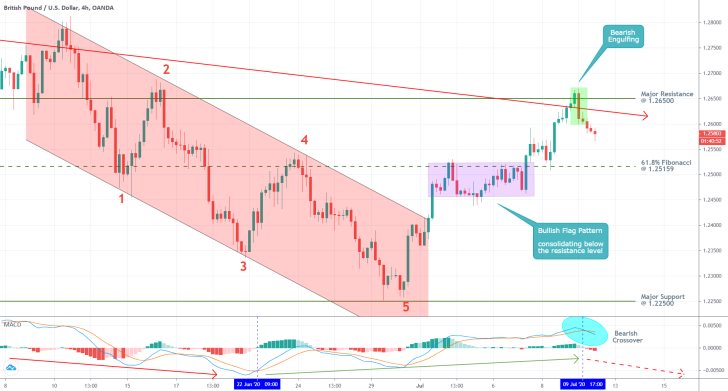
The 4H chart below underpins the currently changing market sentiment. The 'Bullish Flag Pattern' was completed when the price action rebounded from the major resistance level at 1.26500. As can be seen, this rebound has created a 'Bullish Engulfing' pattern, which entails bearish sentiment as well.
The existence of the quite clearly visible 1-5 impulse wave pattern (encompassed by the descending channel in red) means that the underlying price action is prone to establishing easily recognisable swings under the observed range-trading conditions. In other words, we are likely to witness similar seesawing price action as the new downswing develops.
The bearish crossover on the MACD indicator underpins the recent change in the direction of the underlying market momentum. The previously bullish momentum (underscored by the green arrow on the MACD) reached a peak that is lower than the highest point of the preceding 1-5 impulse pattern. This reading of the MACD is consistent with the primary expectations for a price reversal.

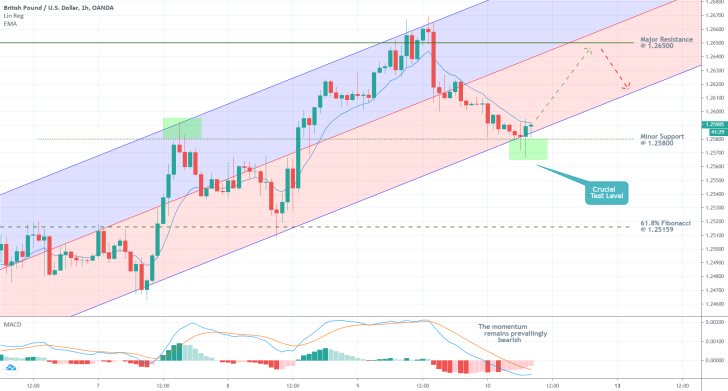
In the short-term, however, the situation looks slightly different. As can be seen on the hourly chart below, the price action appears to be failing the crucial test level at 1.25800 for the time being. The minor support level there, which previously served as a resistance, is holding back the price action, which could result in a temporary bullish correction.
Unsurprisingly, the minor support level at 1.25800 coincided with the floating lower limit of the ascending channel around the same time the price action failed to break down below the two. We could potentially see a correction towards the major resistance level at 1.26500 before the GBPUSD resumes heading south.

3. Concluding Remarks:
The GBPUSD looks poised to establish a new downswing towards the range's lower boundary. Since the market is still in the early stages of developing such a reversal, the underlying market volatility could rise. Additionally, the price action could continue to fluctuate around the current market price for some time before it gets ready to start depreciating more significantly.

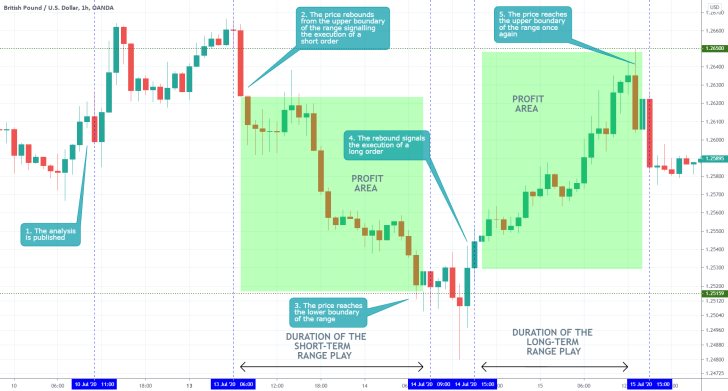
- The analysis had almost perfect short-term projections with excellently drawn levels of support and resistance. Traders need to remember to give themselves praise when it is truly warranted. The above setup represents an excellent example of range-trading play.
Disclaimer: Your capital is at risk! Trading and investing on the financial markets carries a significant risk of loss. Each material, shown on this website, is provided for educational purposes only. A perfect, 100% accurate method of analysis does not exist. If you make a decision to trade or invest, based on the information from this website, you will be doing it at your own risk. Under no circumstances is Trendsharks responsible for any capital losses or damages you might suffer, while using the company’s products and services. For more information read our Terms & Conditions and Risk Disclaimer.


