The most popular currency pair in the world has undergone through several quite turbulent and eventful days recently. Joe Biden's victory in the US Presidential Race was undoubtedly the most fundamentally significant development from last week, which is bound to exert long-lasting impact on the pair. The effect of the new President-elect soothed the stirred stock market but many questions remain uncertain.
Donald Trump's earlier decision to postpone the fiscal stimulus talks still poses a significant threat for the tentative recovery in the country, and not even Friday's better-than-expected Non-Farm Payrolls data was able to offset this adverse impact.
As regards monetary policy, both the ECB and the FED decided to remain vigilant in November without making any drastic changes to their stances at the current time. In the two Bank's statements, however, it was alluded to likely adjustments in December as new data comes in. The expectations for further monetary interventions towards the end of the year, when liquidity typically falls during the festive period, looks poised to cause more volatility outbursts for the EURUSD.
Overall, the greenback has been quite strained over the last several trading days owing to the persisting uncertainty in the US, while the single currency has temporarily reinstated its role as a hedging asset during the coronavirus pandemic. The price action of the EURUSD remains ranging, which would allow for the implementation of appropriate trading strategies.
Finally, the GDP numbers in Europe and CPI data in the US, which are scheduled for release later this week, could change the underlying dynamics between the two currencies as the price action of the pair potentially shifts directions one more time.
1. Long-Term Outlook:
As can be seen on the daily chart below, the price action of the EURUSD remains concentrated within the same Distribution range that was outlined in our previous analysis of the pair. The lower boundary of the Distribution is underpinned by the 23.6 per cent Fibonacci retracement level at 1.16839, while the psychologically significant resistance manifests its upper border at 1.20000.
Interestingly enough, there is a range within the range (Distribution), which has the same lower edge and an upper limit represented by the major resistance level at 1.18700. There are two plausible scenarios where – the price action could rebound either from the upper limit of this minor range or it could shoot up towards the upper band of the Distribution before it veers down south.
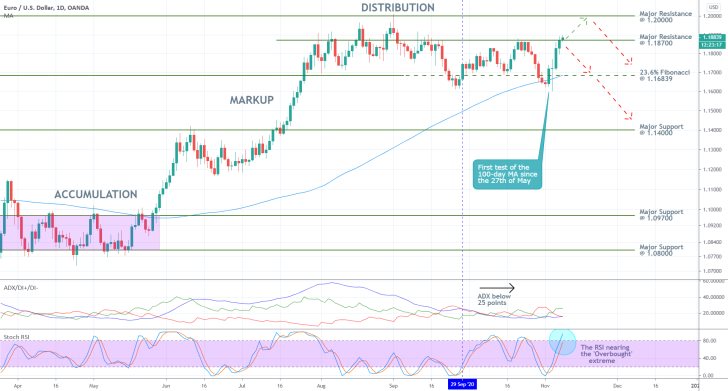
Several key factors substantiate the expectations for the development of a new dropdown. Firstly, the ADX indicator has been threading below the 25-point benchmark since the 29th of September, which confirms the range-trading environment.
Secondly, the Stochastic RSI indicator can be utilised under these ranging conditions to pinpoint the likely turning points for the direction of the price action (for as long as the market remains ranging). Given that the indicator is nearing it's Overbought' extreme while the price action is testing the strength of the lesser range's upper border, a new bearish rebound seems increasingly likelier.
Thirdly, in the wake of the US Elections, the price action rebounded not only from the 23.6 per cent Fibonacci but also from the 100-day MA (in blue). This was the first test of the moving average since the 27th of May. Naturally, the underlying price action breaking below/above such MAs while the market is ranging is quite rare, which is why the recent upswing does not seem so surprising at all. Even still, the price action is almost certainly going to test this MA at least one more time in the near future because of the same ranging conditions.
2. Short-Term Outlook:
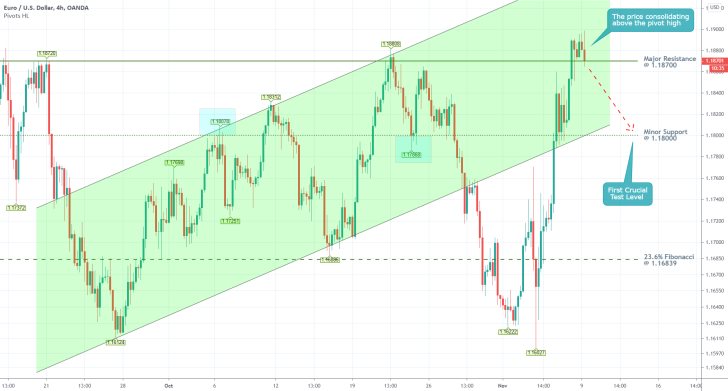
More pieces of evidence justifying these bearish expectations can be found on the 4H chart below. As can be seen, the price action is currently consolidating just above the upper edge of the minor range, which is also where the last pivot high was established. Such behaviour of the price action is consistent with the expectations for sudden pullbacks, especially given the aforementioned range-trading conditions.
Even if a pullback was to develop immediately, however, this should not be interpreted as a definite sign of a new correction towards the 23.6 per cent Fibonacci. A crucial test for the price action's readiness to tumble towards the Distribution's lower limit is underpinned by the minor support at 1.18000.
The significance of the latter is confirmed by the fact that it currently converges towards the lower limit of the ascending channel, as well as being outlined by two previous pivot points.
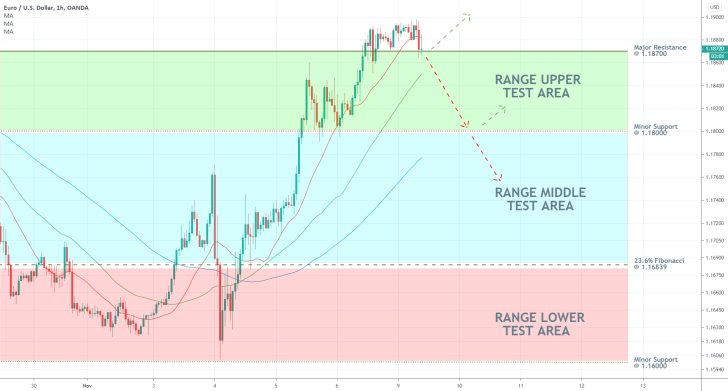
In preparation for the implementation of appropriate range-trading strategies, traders need to be aware of the behaviour of the price action within three crucial areas, as seen on the hourly chart below. Firstly, if the price action does not retrace back below the major resistance at 1.18700 in the immediate future, this would clear the way for another attempt at testing the Distribution's upper edge – this seems unlikely given the 'Overbought' reading of the RSI.
Secondly, a breakdown below set resistance would likely entail the possibility of a dropdown towards the lower limit of the 'Range Upper Test Area', represented by the minor support at 1.18000.
A breakdown below 1.18000 and the 100-day MA (in blue) would clear the way for further tumble towards the 23.6 per cent Fibonacci. Keep also in mind that even though the area in red is labelled 'Range Lower Test Area', it is positioned below the Distribution itself. That is so because the price action could attempt to test the bearish commitment in the market in that area before possibly pulling back. If it manages to fall below the recent swing low, this would mean that the ranging sentiment is no longer existing and that a new Markdown could be in the making.
3. Concluding Remarks:
This week is going to be much calmer compared to the previous one, in terms of fewer events that are scheduled to take place. The expectations for diminished volatility should complement the current ranging market conditions of the EURUSD, resulting in a likely dropdown towards the range's lower boundary.
The EURUSD Continues to be Range-Trading
The most popular currency pair in the world continues to be range trading, as per the longer-term projections of the initial analysis. This neutral market sentiment is likely to be preserved in the near term given the uneventful week ahead.
Meanwhile, the news from earlier today that Moderna's developmental vaccine is nearly 95 per cent effective in preventing the symptomatic spread of SARS-Cov-2 boosted the global capital markets, which are still riding high from the similar achievement of Pfizer and BioNTech.
Renewed investors' enthusiasm has bolstered the greenback as markets weigh in on the reduced likelihood for extensive lockdowns across the world. In other words, the dollar rallies whenever the market is not fearful of the possibility for new disruptions to the global economic activity. In contrast, the euro continues to fluctuate randomly as the ECB left all monetary policy deliberations for December, which exposed the single currency to more uncertainties.
Given the most recent fundamental developments, the EURUSD looks poised to head towards the lower boundary of the broader range.
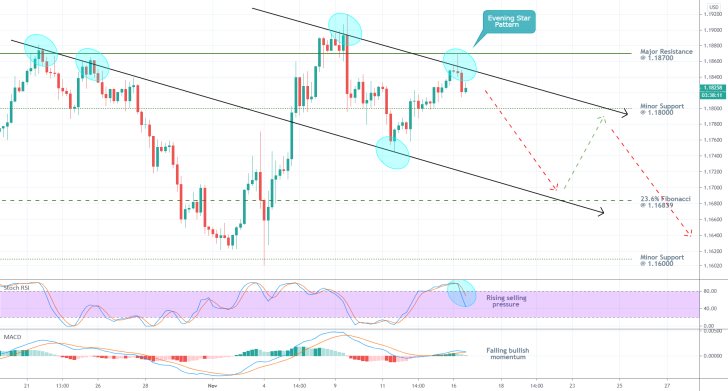
As can be seen on the 4H chart above, the price action is currently contained within the boundaries of a recently established descending channel. The significance of the lower boundary of the channel was tested on three separate occasions, while its upper limit was tested only twice. Moreover, the second test occurred earlier today, with the subsequent rebound taking the form of an Evening Star pattern.
Evening stars are typically found at the upper end of a bullish trend or a minor upswing and are taken to represent increasing selling pressure which usually leads to a bearish reversal. Given that in this case the Evening Star emerged just below the major resistance level at 1.18700 as the price action was testing the upper edge of the channel, there seems to be a pretty solid case for expecting such a bearish reversal.
In addition to the aforementioned fundamentals and the recent behaviour of the price action, the MACD indicator demonstrates swiftly depreciating bullish momentum, while the Stochastic RSI manifests rising selling pressure. The latter is an especially significant selling signal in light of the aforementioned range-trading conditions. In other words, there seems to be a confluence of bearish signals.
If the price action manages to break down below the minor support level at 1.18000, the next target for the developing downswing will be the lower boundary of the channel – potentially close to the 23.6 per cent Fibonacci retracement level at 1.16839. Given the psychological significance of the latter, another bullish upswing can be anticipated to form afterwards. Such a correction is likely to test the minor support level at 1.18000 from below before the price action continues trading lower.
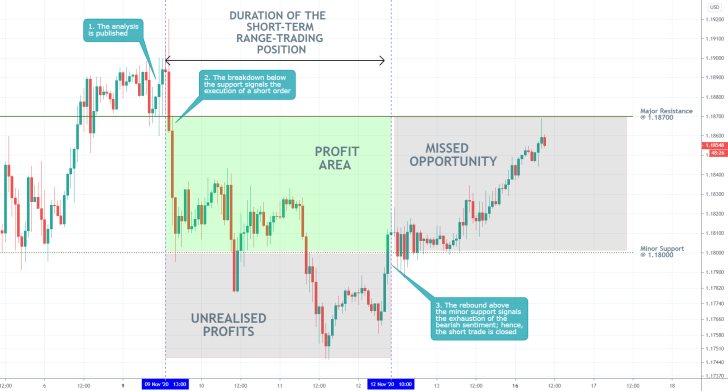
- The analysis correctly anticipated an imminent dropdown shortly after its publication; however, it was unable to account for unforeseeable developments such as the US labour data for October and the COVID-19 vaccine news, both of which affected the underlying market dynamics.
- The rebound above the minor support at 1.18000 signalled the exhaustion of the short-term bearish pressure, which prohibited further depreciation of the price action. The biggest failure of the above setup was the late realisation that the underlying market bias has changed, which could have been used to capture more profits (encompassed by the 'Missed Opportunity' area). Traders need to be aware of any incoming data (when they have open positions), and more importantly, be willing to factor in unforeseeable developments into the projections of their fundamental analyses.
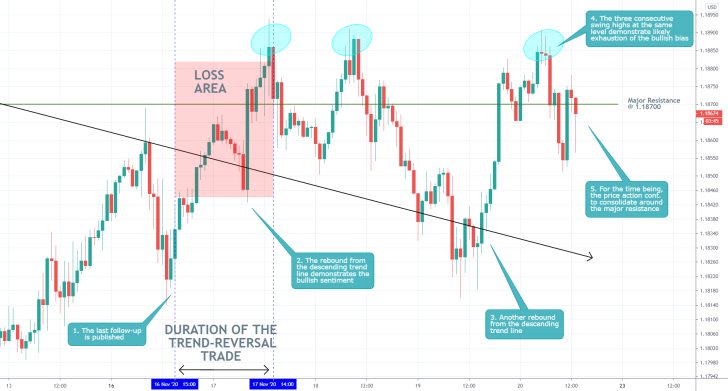
- The projections of the last follow-up were fundamentally wrong. The EURUSD did not slide further down south because the Moderna vaccine news had an inverse impact on the value of the greenback as a safe-haven asset. At any rate, the incurred loss of around 30 pips is smaller than the initially gained 62 pips, which makes the analysis as a whole profitable.
- This is a good example of why traders need to use narrow stop losses in order to protect themselves against unexpected developments.
Disclaimer: Your capital is at risk! Trading and investing on the financial markets carries a significant risk of loss. Each material, shown on this website, is provided for educational purposes only. A perfect, 100% accurate method of analysis does not exist. If you make a decision to trade or invest, based on the information from this website, you will be doing it at your own risk. Under no circumstances is Trendsharks responsible for any capital losses or damages you might suffer, while using the company’s products and services. For more information read our Terms & Conditions and Risk Disclaimer.


