Since the release of our previous analysis on the NZDUSD on the 3d of February, the pair has moved by more than 200 pips in our projected direction. In light of the recent global developments, however, concerning the spread of the coronavirus internationally and the interest rate cut in the US, the underlying market sentiment has changed dramatically.
The two respective currencies now face entirely different outlooks, and this should be taken into consideration. With the changing socio-economic landscape globally, the underlying market pressures that are having a noticeable impact on the NZDUSD are changing as well. All of these factors are contributing to the new trading opportunities on the pair, which involve the possibility for the implementation of trend reversal trading strategies.
The price of the NZDUSD finds itself at the lower end of a prevailing bearish market, but there are now strong indications pointing towards a likely change in the underlying direction of the price action. That is why the present analysis is aimed at underscoring those internal and external pressures in order to investigate the most likely development of the price action in the short run.
1. Long Term Outlook:
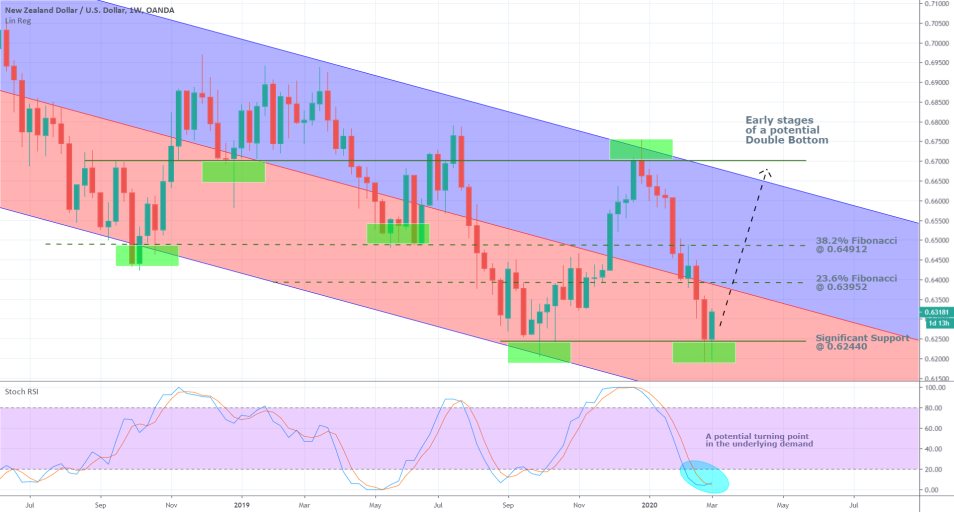
The first significant observation that can be made on the price action represented on the weekly chart below is that since early October 2019 the NZDUSD has undergone quite distinctive directional trading, lacking considerable adverse fluctuations. Said in other words, the price action is establishing clearly observable swings, which are not diluted by directionless fluctuations, that are common for range trading environments. Such underlying conditions are favourable for the implementation of trend reversal strategies.
The price has bounced back from the significant support level at 0.62440, which could be perceived as an early stage in the development of a double bottom pattern (inverted double top). Thus, going long at the present rate could prove to be quite fruitful in the long run, provided that the price action continues evolving on its current course.

There are several primary evidence pointing to the likely termination of the previous bearish swing. Firstly, the long lower shadows of the last two candlesticks (representing the current and the past weeks) are illustrative of waning bearish commitment and the price's inability to extend the downswing's development below the critical support level.
Secondly, the stochastic Relative Strength Index (RSI) is showing that the accumulated selling pressure from the execution of multiple short orders has reached an extreme – the ‘Oversold’ area on the indicator’s chart. The stochastic EMA and the index itself are currently in the process of finishing a bullish crossover, which would imply rising demand for the NZDUSD.
Additionally, each time that the index is threading in one of the two extremes is a potential green light for contrarian traders to enter the market on the presumption that the underlying price is about to change its direction. Thus, the RSI itself could prompt the execution of new long orders, which, in turn, would increase the underlying demand, resulting in the appreciation of NZDUSD’s price.
If the price continues to rise in the following days and weeks, there will be three crucial levels that it will have to break out above before the double bottom pattern is completed. Those include the 23.6 per cent Fibonacci retracement level at 0.63952; the 38.2 per cent Fibonacci retracement level at 0.64912 and the major resistance level at 0.67000, which also has psychological importance due to the three zeroes at the end. Each of these three marks represents a significant stepping stone in the development of the double bottom pattern, but they could also pan out to be major turning points in the direction of the new bullish trend. Thus, major pullbacks could be initiated around those three levels.
2. Fundamentals Currently at Play:
The most significant reason for the expectation of a trend reversal on the NZDUSD is the underlying fundamentals, which are currently affecting the forex market as well as the other global capital markets.
- In the US. In an unexpected move yesterday, the FOMC of the FED decided to cut the federal funds rate by half a percentage point. The interest rate in the states is currently at 1.25 per cent.
The decision was implemented in a bid by the central bank to curb the negative impact of the coronavirus’ outbreak globally on the American economy. By loosening its underlying monetary policy, the FED aims to boost the available liquidity for businesses in the states. By making borrowing cheaper, the Committee plans to bolster the economic activity in the country, which is expected to promote growth in the midterm.
The indirect consequence of the reduction of the interest rate is the weakening of the dollar. With the lower interest rate, the greenback will be disadvantaged against other major currencies, as investors and traders' trust in the dollar would be shaken. This is especially true now since the Euro seems to be the preferred go-to currency at times of global crisis and rising concerns.
As regards the NZDUSD, the weakening of the dollar comes at a time when the NZD finds itself at the lower end of a major depreciation cycle, which is what is prompting traders and investors to believe that the kiwi’s bearish market is coming to an end. In short, FED’s decision to cut the federal funds rate from yesterday comes at an ideal time to support a bullish trend reversal on the NZDUSD.
- In New Zealand. The Reserve Bank of New Zealand would most likely turn to cutting its interest rate as well, in order to curtail the general uncertainty that is currently looming over the New Zealand economy. The Monetary Policy Committee (MPC) of the RBNZ is scheduled to meet on the 25th of March, which is when it is likely to move forward with the implementation of a looser monetary policy.
The decision of the RBA to reduce the level of interest in Australia might shed light on how and why the RBNZ would behave on its monetary gathering at the end of March. The interconnectedness of the New Zealand economy with the global supply networks might leave the MPC of the RBNZ with no other alternatives.
Even if the RBNZ cuts the interest the perceived impact on the kiwi would likely be different from the exerted impact on the dollar from FOMC's decision. In the states, the decision to reduce the level of interest was perceived more or less like a desperate move on the part of the FED, which contributed to the weakening of the greenback. In New Zealand, however, similar actions would most likely be perceived as a necessary move at a time when the economy needs a more accommodative monetary policy.
Thus, even with lesser interest, the NZD is more likely to continue appreciating against the dollar, similar to the Australian dollar.
3. Short Term Outlook:
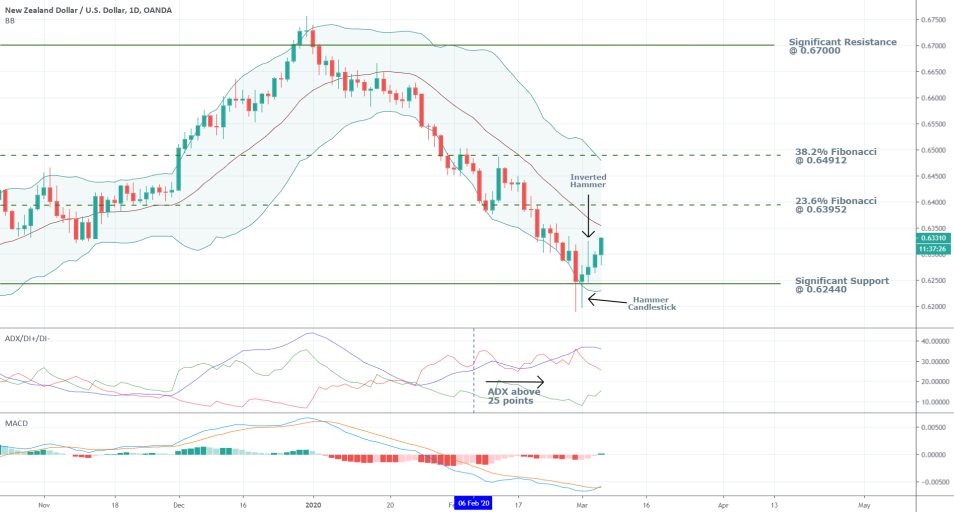
The narrowing Bollinger Bands (BB) on the daily chart below demonstrate waning volatility, which could be interpreted in one of two ways. Either that a new bearish correction is due shortly, or that the current bullish swing will need more time before it is further extended.
The hammer and the inverted hammer candlesticks, which are in close proximity to each other, exemplify the termination of the previous bearish swing. Thus, they also confirm the rising bullish commitment in the market. However, the first prominent stepping stone in the way of the new bullish trend is the middle line of the BB. If the price fails to break out above it, a short-term pullback might form.

The ADX exemplifies the strength of the trending environment, so traders are advised to continue monitoring it. If its value falls below 25 points, this would mean that the market is not ready to transition from a bearish trending environment into a bullish one without an intermediary period.
The MACD too is at a crucial turning point. The recent bearish momentum seems all but exhausted, so the underlying price would have to continue rising in order for the new bullish momentum to start picking up steam.
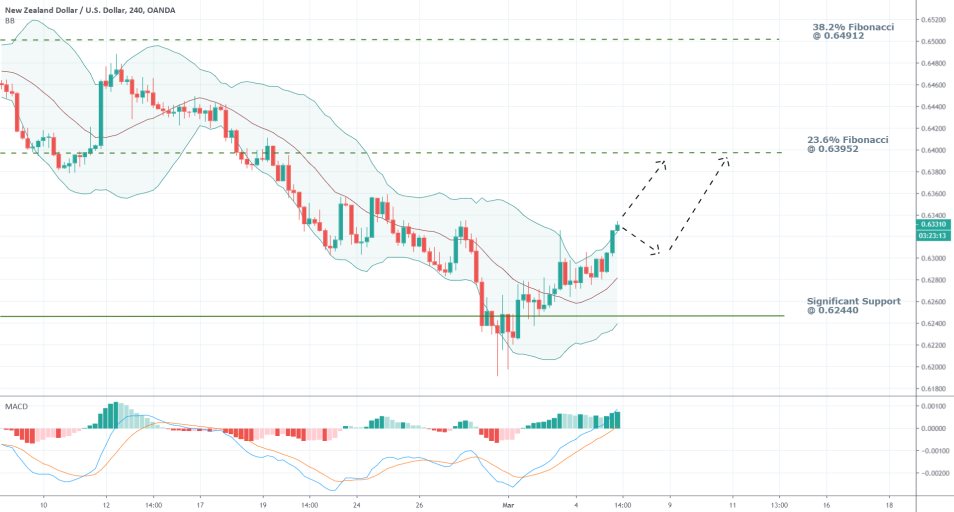
The 4H chart below demonstrates the likely behaviour of the price in the foreseeable future. The continuation of the broader bullish swing’s development could proceed in one of two ways. The price is likely to either form an immediate pullback, if it finds resistance from the BB’s middle line on the 1D chart, and only afterwards resume appreciating; or it could continue its uninterrupted appreciation right away.
The rising value of the MACD in conjunction with the rising BBs on the 4H both attest to the strong bullish commitment in the short term.

4. Concluding Remarks:
Lengthy trading on the expectation for a trend reversal entails certain risks. The price could form considerable corrections, including to the significant support level at 0.62440, which would wipe out most imprecise long orders; especially the ones with shallow stop-losses.
Thus, the promise for profitable trading on a largescale trend reversal play should not be taken lightly and carelessly. All trade execution should be done with the utmost precision.
Longer-term traders might be inclined to wait for NZDUSD's price to form a dip at the lower end of the first pullback so that they can enter long at a discount.

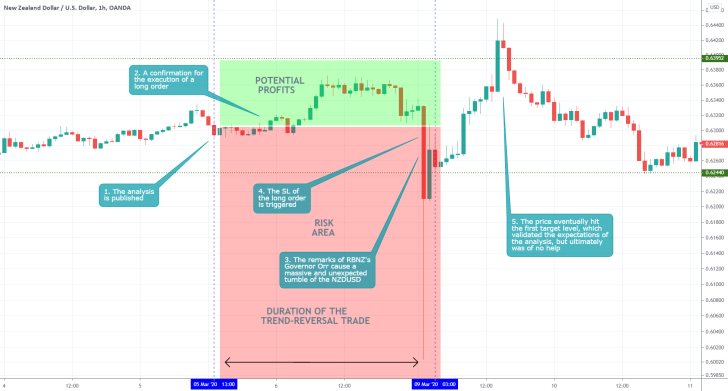
- The short-term expectations of the analysis regarding the formation of a minor bullish correction were justified, but were impeded by a 'Black Swan' – type event. A speech by the Governor of the RBNZ caused the price of the NZD to plummet; and the negative impact of his speech could not have been anticipated beforehand. The existence of such unexpected developments on the market, oftentimes referred to as Black Swans, is why the implementation of tight stop loss orders is so vital. Moreover, another crucial takeaway from this analysis is the need for traders to take into consideration the impact of off working hours trading on their positions. Chiefly, what happens to their positions during the weekends when they do not have any control over their positions. Traders need to remember that whenever they leave open positions over the weekend, they risk incurring losses from such unexpected developments, without being able to respond to them.
Disclaimer: Your capital is at risk! Trading and investing on the financial markets carries a significant risk of loss. Each material, shown on this website, is provided for educational purposes only. A perfect, 100% accurate method of analysis does not exist. If you make a decision to trade or invest, based on the information from this website, you will be doing it at your own risk. Under no circumstances is Trendsharks responsible for any capital losses or damages you might suffer, while using the company’s products and services. For more information read our Terms & Conditions and Risk Disclaimer.


