At the close of last week's trading session, the Nasdaq composite broke out above the psychologically significant resistance level at 13000.00 and closed at an all-time peak (13105.20). The U.S. technological sector is evidently performing quite well just days before the beginning of the new earnings season.
The appeal for tech stocks has risen over the recent weeks due to the historically low yields in the U.S., which has prompted an upsurge in demand for higher-risk securities.
Given also that the global roll-out of vaccines - yesterday it was announced that over 24 million doses have already been administered internationally - is exceeding all expectations, the underlying market optimism may be here to stay. All of this is likely to support Nasdaq's rally in the long-term; however, there could be an opportunity for contrarian trading in the short-term.
Small corrections tend to develop around significant resistance levels such as the one mentioned earlier, giving the market bears an opportunity to catch such a minor dive. In contrast, market bulls who do not currently have any open buying positions could wait for the price action to reach a new dip before they buy-into the market.
That is why it is worth examining the underlying possibility for the establishment of such a correction for both bulls and bears.
1. Long-Term Outlook:
As shown on the daily chart below, the price action broke out above the upper boundary of an ascending triangle recently, which underpins the bullish commitment in the market. Shortly after the breakout was established, the price retraced back to this boundary (representing a throwback), which confirmed this level's significance - the support at 12200.00. Consequently, this support becomes a prime target-level for a potential bearish correction.
Moreover, the 12200.00 support is currently converging with the 50-day MA (in green) and will soon do the same with the 100-day MA (in blue). Both of these floating supports represent likely reversal points for the price action. In other words, the likelihood of a bearish correction reaching a dip around the 12200.00 is further bolstered when the level coincides with one of the two prominent MAs. Such a rebound has already occurred once - the last time the price action tested the 100-day MA, which, at that point, was converging with the lower boundary of the ascending triangle.
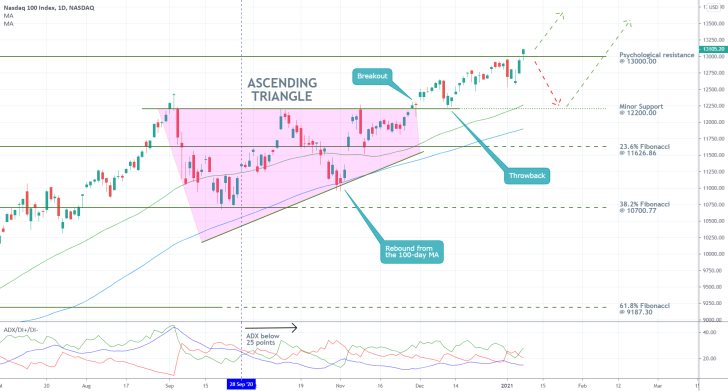
While the possibility of the price action continuing to rally without establishing an interim correction remains open (in which case there should be no entries in the market), a retracement below the psychological resistance would allow for such contrarian trading. Meanwhile, the bulls would be looking to utilise trend-continuation trading strategies, possibly around the support at 12200.00.
Notice also that the ADX indicator has been threading below the 25-point benchmark since the 28th of September. This means that technically, the market is currently range-trading, and the recent breakout above the Ascending Triangle has not affected the underlying sentiment greatly. This environment is suitable for the emergence of bearish corrections and pullbacks.
2. Short-Term Outlook:
As regards the behaviour of the price action in the short-term, the underlying sentiment looks more decidedly bullish. This can be seen on the 4H chart below. The latest upswing appears to be taking the form of a 1-5 impulse wave pattern, as postulated by the Elliott Wave Theory. Seeing as how the price action is currently in the process of finalising the last impulse leg (4-5), once this is done, a resulting bearish correction seems highly probable.
The underlying bullish bias in the short-term can be confirmed using the Ichimoku Cloud indicator. The nearest cloud itself will test a potential bearish correction. Hence, a minor support level can be drawn at 12600.00. This means that unless the price action continues ascending right away, a new dropdown could bottom out near the cloud's lowest point. That is why the bears need to be mindful of signs of consolidation around 12600.00.
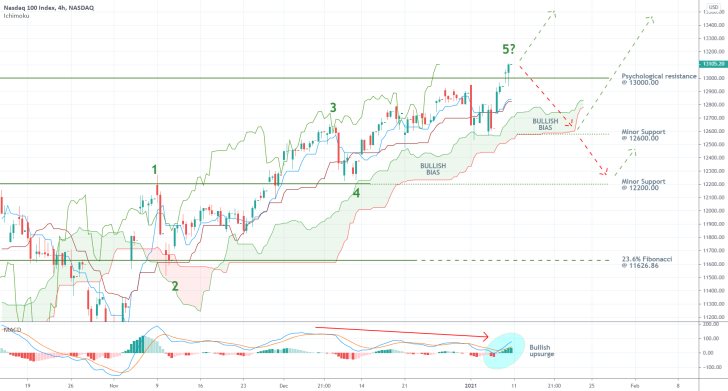
As regards the prevailing momentum at present, the MACD indicator underpins a recent upsurge in bullish pressure. This bullish crossover correlates to last week's breakout above 13000.00. Nevertheless, it should also be stated that the overall momentum has been gradually waning (as highlighted by the red arrow), which is evocative of a probable Divergence. Such divergences typically entail likely reversals in the direction of the price action, which is inlined with the expectations for an eventual correction.
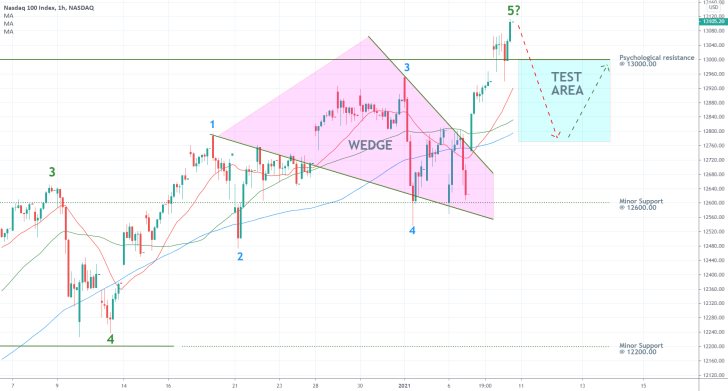
Finally, the latest behaviour of the price action is examined on the hourly chart below. The aforementioned 4-5 impulse leg is itself a 1-5 impulse wave pattern, which is drawing near to completion.
The current positioning of the three moving averages - the 20-day (in red), the 50-day (in green), and the 100-day (in blue) - underpins the boundaries of a Test Area (in light blue). This is where the bearish commitment of a potential correction is going to be tested.
3. Concluding Remarks:
The bears should not place any selling orders unless the Nasdaq breaks down below the psychological resistance at 13000.00. They should be aware of the fact that contrarian trading in an otherwise bullish market will entail a high degree of risk, which is why this approach is not suitable for highly risk-averse traders. Moreover, the possible extent of such a correction might vary greatly - to the minor support at 12200.00 at the best or the lower boundary of the Test Area at the worst.
On the other hand, the bulls can patiently wait for the market to bottom out (at any of the aforementioned levels) before they utilise any trend-continuation trading strategies. They should keep in mind that as the earnings season kicks off at the end of the week, so the underlying volatility is likely to increase sizably. This will consequently increase the risk they face.
The Nasdaq Continues to Flirt with a Psychological Resistance Level
The Nasdaq composite index remains consolidating just below the psychologically significant resistance level at 13000.00, as was the case at the time of the original analysis` publication. Part of the explanation as to why its price action appears to be somewhat subdued has to do with the current earnings season's timing. Even though prominent companies started reporting last week, no tech giants have done so yet, with the exception of Netflix.
In other words, the technological sector is next in line to deliver its earnings numbers after the banking sector, which is when the Nasdaq is likely to become more volatile. This is most likely to take place next week when Microsoft, Apple, AT&T, Tesla, and others are due to report.
Even still, there are other potential catalysts taking place this week that could jolt Nasdaq's price action. Namely, Joe Biden's inauguration to the Oval Office. As the president-elect officially accepts the role of America's 46th president, investors and traders would likely perceive this as the beginning of a new chapter of U.S. policymaking. Such transformational changes to Washington's political arena typically set the stage for the start of new long-term trends in the stock market.
Meanwhile, the price action's behaviour in the short-term continues to exhibit strong signs of a potential correction. Owing to the aforementioned resistance's psychological significance, contrarian traders may yet utilise this opportunity for a possible dropdown to the next support level. Subsequently, the resulting dip would allow for the execution of trend-continuation trades on the anticipations for sustained price appreciation.
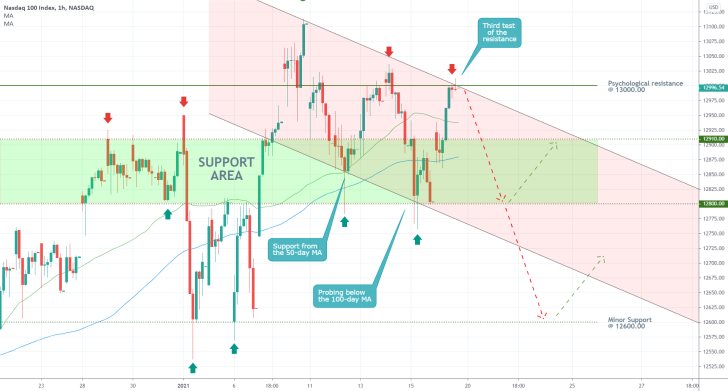
As can be seen on the hourly chart above, the Nasdaq's price finished yesterday's trading session by closing at the 13000.00 resistance. While today's session can begin with a positive gap after the market opens, the price action is more likely to continue retracing by the end of the trading day.
Hence, bears should look for an opportunity to enter short below the descending channel's upper boundary after the market open. However, if the price action starts climbing instead of promptly retracing back below the 13000.00 mark, no such actions should be implemented.
The support area in green encapsulates the first target for a likely new bearish correction. The latter has the 12800.00 level as its lower boundary and the 12910.00 level as its upper limit. The former's significance has already been confirmed on three separate occasions, whereas the prominence of the latter has been tested twice. Meanwhile, the minor support at 12600.00 remains the second target-level, as was also argued in the initial analysis.
Notice that the price action rebounded from the 50-day MA (in green) before testing the psychological resistance for a second time. Subsequently, it dived below the 100-day MA for a short while before shooting back up for a third test of the 13000.00 barrier. This behaviour entails mounting bearish pressure in the market, which is favourable for the emergence of a more significant bearish correction.
As always, traders should not forget that such setups for contrarian trading typically entail a high degree of risk, which is not suitable for all. More cautionary traders can instead wait to see if the price action consolidates within the Support Area or near the minor support at 12600.00 next, which would signal an opportunity to go long at the resulting swing low. Keep in mind that the Nasdaq finds itself in a strong bullish uptrend.
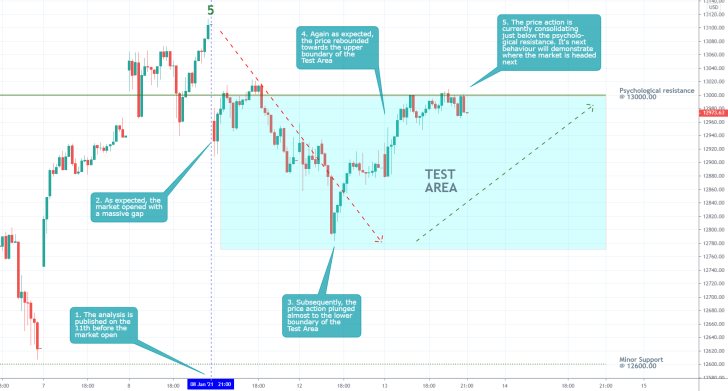
- So far, the market is behaving exactly as anticipated. The price action concluded the 1-5 impulse wave pattern and plunged immediately afterwards. It reached the lower part of the Test Area before recovering some of these losses.
- It is currently consolidating just around the psychological resistance at 13000.00, and its further behaviour would underpin the next most likely direction for the price action. As was argued in the analysis, a breakout would underscore the strength of the bulls, whereas a new bearish rebound would imply that the Nasdaq is not yet ready with the bearish correction.
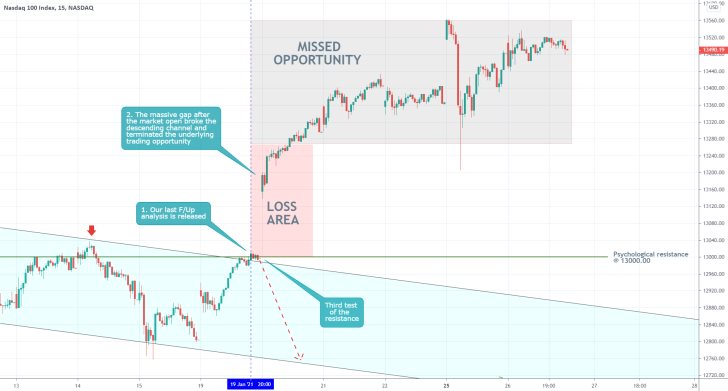
- The last follow-up analysis of the Nasdaq expected the price action to rebound from the psychological resistance at 13000.00 for a third time and to continue falling within the boundaries of the descending channel. Instead, the market opened with a massive gap on the very same day. The advantage of the analysis was its emphasis on the high degree of risk that is associated with contrarian trading, which prevented further losses.
- The biggest takeaway here is that when trading with stocks/indices, there is extra risk associated with off-hours trading. Something can always happen while the market is not open, which prevents traders from adjusting their positions. That is why these instruments are not ideal for, say, CFD trading, the success of which depends heavily on timely adjustments.
Disclaimer: Your capital is at risk! Trading and investing on the financial markets carries a significant risk of loss. Each material, shown on this website, is provided for educational purposes only. A perfect, 100% accurate method of analysis does not exist. If you make a decision to trade or invest, based on the information from this website, you will be doing it at your own risk. Under no circumstances is Trendsharks responsible for any capital losses or damages you might suffer, while using the company’s products and services. For more information read our Terms & Conditions and Risk Disclaimer.


