The price of crude oil has been depreciating over the past few weeks as global energy demand subsided a little bit. This process was bolstered following the last FED meeting.
Even though the current underlying sentiment is prevailingly bearish, it is unlikely for crude oil to develop a major bearish trend. Instead, the price of the commodity is likely to consolidate around the next Fibonacci support before the broader rally can be resumed.
With the beginning of the new earnings season in the U.S., selling pressure in the commodity market is likely to ease as investors and traders turn their attention to stocks. This is likely to positively impact the price of crude oil over the next several weeks.
Overall, the price action is likely to transition from the recent bearish correction into a new bullish uptrend over the near future, which entails trading opportunities for bulls and bears alike.
How Low Can the Correction Go?
The price of crude oil has recently broken down below the lower boundary of the regression channel, as shown on the daily chart below. This is demonstrative of strong bearish pressure in the short term. The breakdown came after a failed initial test of the 23.6 per cent Fibonacci retracement level at 72.30, followed by a pullback to the channel's middle line.
The next level where the price is most likely to find support is the 38.2 per cent Fibonacci at 69.44. If, however, the latter does not hold the correction, the downswing can be extended as low as the 61.8 per cent Fibonacci at 64.83. It remains to be seen whether enough selling pressure would be accumulated for such a turn of events.
Notice that the regression channel underpins a broad 1-5 impulse wave pattern, as postulated by the Elliott Wave Theory. Moreover, each impulse and retracement leg is comprised of smaller Elliott structures. Since the most recent impulse leg (2-3) appears to have peaked near the channel's upper boundary, the price action is currently establishing the next retracement leg (3-4).
If this holds true, it will substantiate the aforementioned expectations that the current bearish correction needs to bottom out before the broader uptrend can be resumed. That is why the correction appears most likely to bottom out at the 38.2 per cent Fibonacci.
This entails trading opportunities for bears in the short term, whereas bulls can look for a chance to utilise trend continuation strategies in the longer term.
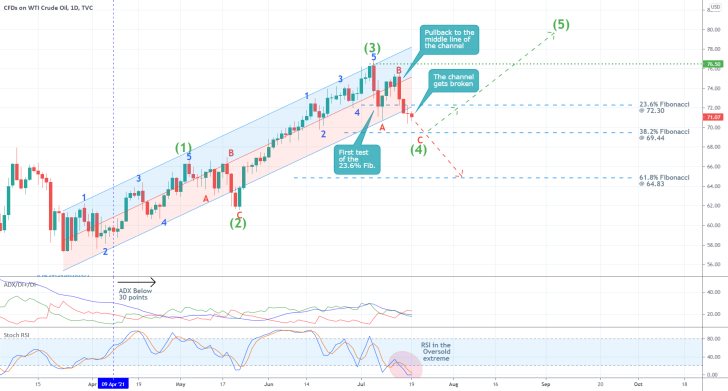
Notice that the ADX indicator has been threading below the 30-point mark since the 9th of April. A reading below 25 points means that the market is ranging, whereas a reading above 25 points that it is trending. Hence, the current sentiment represents a very weak uptrend, which is why a bearish correction is presently unfolding.
However, the Stochastic RSI indicator is currently in its oversold extreme, which means that buying pressure will likely resume increasing shortly. This is inlined with the expectations for a rebound near the 38.2 per cent Fibonacci.
Waiting for the Eventual Rebound
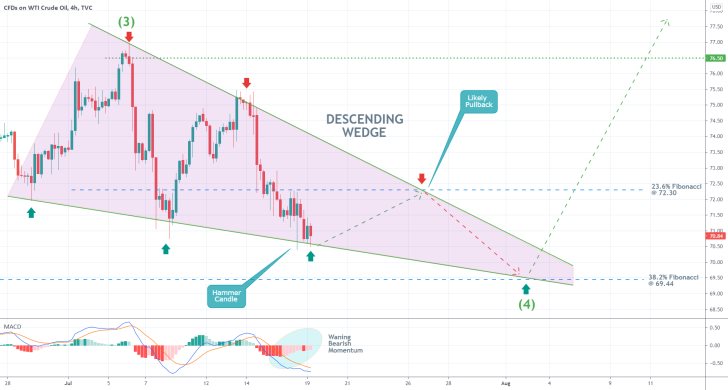
When examined on a smaller timescale, the underlying correction appears to be taking the form of a Descending Wedge pattern. The price action has probed the upper boundary of the pattern on two occasions. It is currently testing its lower limit for the third time.
Unless the price action breaks down below it immediately, it will probably probe the upper boundary of the Wedge one last time. This is likely to take the form of a pullback to the 23.6 per cent Fibonacci from below.
For the time being, the underlying momentum in the short term remains mostly bearish, though the selling pressure is evidently waning. This is demonstrated by the rising histogram of the MACD indicator.
Bulls should consider going long only on the condition that the price action consolidates above the 38.2 per cent Fibonacci or when it breaks out above the bottleneck of the Wedge.
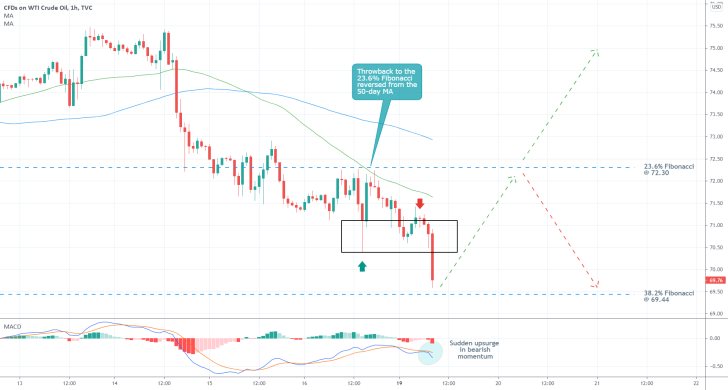
Notice that there was a massive Bearish Marabozu candle just now, which underpins an attempt at continued price depreciation. The MACD indicator picked up this upsurge in bearish momentum on the hourly chart below.
The price action is currently very close to the 38.2 per cent Fibonacci, after having reversed itself from the 50-day MA (in green). This newest behaviour of the price action should be taken under careful consideration by both bulls and bears.
It should also be stated that the 38.2 per cent Fibonacci is positioned very close to the psychologically significant level at 70.00, which is a prominent turning point. This does not preclude the possibility of temporary adverse fluctuations below the Fibonacci support, which also bears psychological importance.
Concluding Remarks:
As regards the current trading opportunities for bulls, they should consider going long ONLY if the price action consolidates above the 38.2 per cent Fibonacci over the next several hours. There is a very high probability of false dropdowns below 69.44, which is why bulls should not rush to buy into the market right away.
Once they go long, they should place tight stop-loss orders just below the 38.2 per cent Fibonacci. Since they'd be trading on the expectations for another bullish rebound, they might have to place several orders before they get the desired entry. They shouldn't instead move their SLs down.
As regards the current opportunities for bears, they shouldn't rush to sell either. Joining the correction so late into its development would entail the risk of sudden bullish rebounds. Instead, bears can potentially enter short near the 23.6 per cent Fibonacci retracement level at 72.30 if there are indications that the eventual bullish rebound is incapable of breaking above this barrier.
Additionally, bears could potentially enter short if the price action manages to break down below the 38.2 per cent Fibonacci decisively. They could do so once the price action establishes a throwback to this level from below (following such a breakdown).
A Confluence of Bearish Indications on the Price of Crude Oil
The price of crude oil recovered by more than $7 over the last several days, following a substantial bearish correction. However, the pullback seems to be running out of steam as the price action looks incapable of breaking out above the psychologically significant 61.8 per cent Fibonacci retracement level at 72.37.
There seems to be a confluence of mounting bearish indications, all pointing to a very likely reversal from said resistance. This entails an excellent opportunity for bears to utilise contrarian trading strategies.
With the ongoing earnings season in the U.S., traders and investors' attention is primed on the stock market, which is exerting extra selling pressure on commodities and energy. Even still, Thursday's GDP data in the U.S. could underpin the accumulation of global demand, potentially offsetting the fallout.
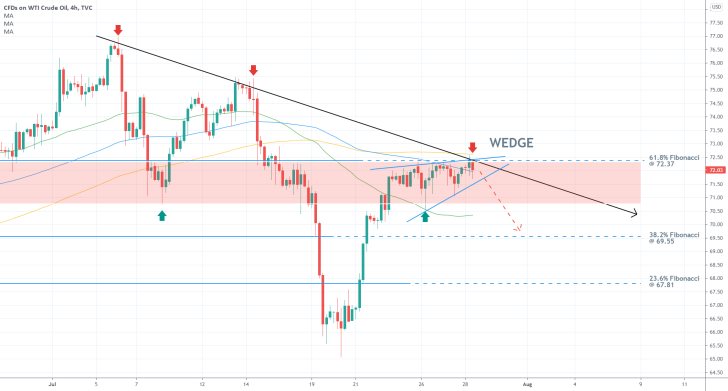
There are several key reasons to expect a bearish reversal in the near future, as shown on the 4H chart above. As stated earlier, the price action is currently consolidating below 72.37, which represents the last major Fibonacci retracement threshold.
This happens just as the descending trend line (in black) crosses this resistance. The price action has already reversed from it on two separate occasions. This is why yet another reversal seems highly probable.
Additionally, the price action is also testing the 100-day MA (in blue) and the 150-day MA (in orange) presently. Both moving averages serve as floating resistances, which adds to the significance of the 72.37 level as a turning point.
Finally, the peak of the pullback appears to be taking the form of an Ascending Wedge, which, when found at the top of a recent upswing, typically signifies a probable reversal. In other words, the emergence of an Ascending Wedge just below the 61.8 per cent Fibonacci and the descending trend line is indicative of waning bullish pressure.
Despite this major confluence of bearish indications, traders should keep in mind that contrarian trading strategies involve a higher degree of risk compared to trend continuation strategies.
That is why they should place tight stop losses, not much higher than the 150-day MA. The first target for the correction is underpinned by the 38.2 per cent Fibonacci retracement level at 69.55. Once the price comes close to it, bears could substitute their fixed stop orders for floating TPs. The second target can be found at the 23.6 per cent Fibonacci at 67.81.
Bears should also take into consideration the fact that the 50-day MA (in green) is currently converging with the psychologically significant support level at 70.00, which is where a bullish rebound could occur. This possibility is made even more likely by the fact that the MA coincides with the lower end of the Distribution area (in red).
The Price of Crude Oil Reverses from a Critical Resistance
The price of crude oil has been consolidating within a narrow range over the past several weeks as global energy demand remained relatively unchanged over the same period. The impact of the robust earnings that were posted for the second quarter was offset by persisting supply bottlenecks worldwide.
These discrepancies between supply and demand, in turn, have prompted temporary upticks in manufacturing activity. However, with the tightening of the pandemic conditions in the southern hemisphere, the aggregate global activity may drop in the third quarter.
All of this could continue to exert selling pressure in the energy market and particularly on crude oil, potentially driving the price of the commodity lower.
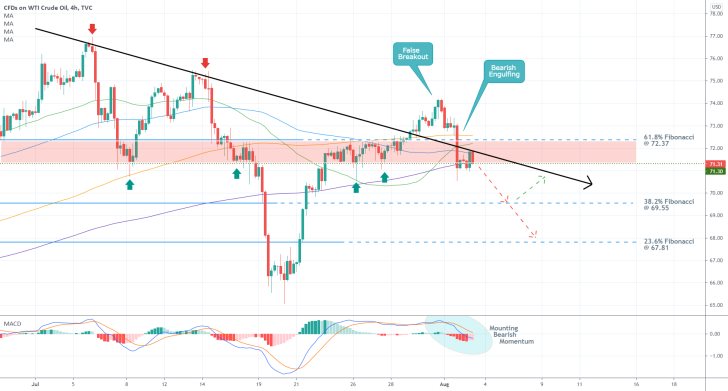
As can be seen on the 4H chart above, the price action established a false breakout above the descending trend line (in black) recently. Afterwards, it promptly returned back below the 61.8 per cent Fibonacci retracement level at 72.37. The dropdown took the form of a Bearish Engulfing candle, which represents the first major bearish indication.
In addition to the fact that the price action is currently threading just below the descending trend line and the Fibonacci barrier, both of which are exceptionally significant resistances in their own right, it is also concentrated within the boundaries of a prominent consolidation range (the area in red).
The latter spans between 72.37 and the major support level at 71.30, the significance of which has already been tested on several occasions in the past. Moreover, the price action is also concentrated below the 200-day MA (in orange), the 100-day MA (in blue), and the 50-day MA (in green).
If it manages to break down below 71.30 and the 300-day MA (in purple) decisively, this would represent a clear indication that the market is ready to establish a new downtrend.
The first target for such a new bearish trend is underpinned by the 38.2 per cent Fibonacci retracement level at 69.55, which is positioned quite close to the psychologically significant support level at 70.00.
Provided that this dropdown is not followed by a bullish rebound towards the descending trend line, the new downtrend could fall as low as the 23.6 per cent Fibonacci retracement level at 67.81.
Bears looking to sell following a potential breakdown below 71.30 should place their stop-loss orders between the descending trend line and the 61.8 per cent Fibonacci retracement level at 72.37.
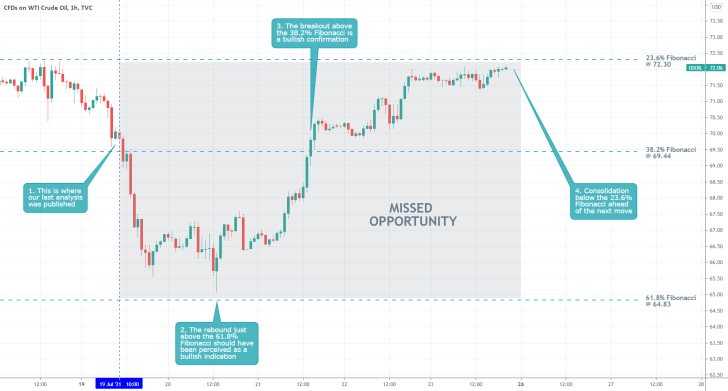
- Even though our last analysis of crude oil failed to garner any profits, it succeeded in more ways than it failed. Chiefly, it explicitly warned against going long around the 38.2 per cent Fibonacci retracement level at 69.44 without sufficient evidence for a price consolidation there.
- However, the analysis failed to account for the eventual rebound just above the 61.8 per cent Fibonacci retracement - the last critical turning point - which could have been used as an opportunity buy into the market at a discount.
- At any rate, traders should feel depressed about missing out on an opportunity, which they've forecasted successfully. It is better to stick to your trading strategy and not join the market when the conditions are not right rather than join the market at an unfavourable level.
- Then, being correct about the general direction of the market would be of no use.
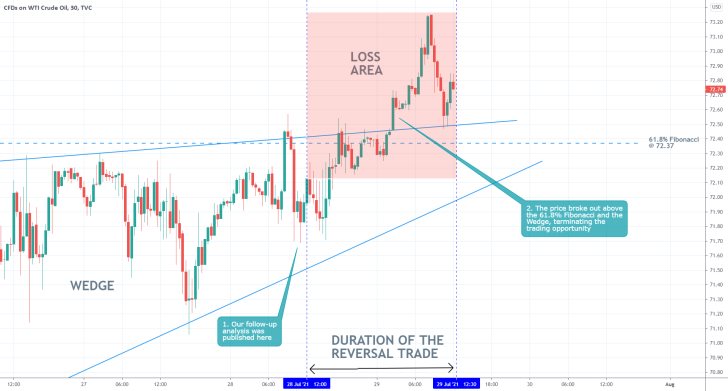
- The expectations of our last analysis of crude oil were not realised. The price did not reverse from the upper boundary of the Wedge pattern and instead broke out above the 61.8 per cent Fibonacci retracement level at 72.37.
- That is why it is so vitally important to place narrow stop-losses above such psychologically important price levels. Traders should not get frustrated as they are bound to make mistakes every once in a while.
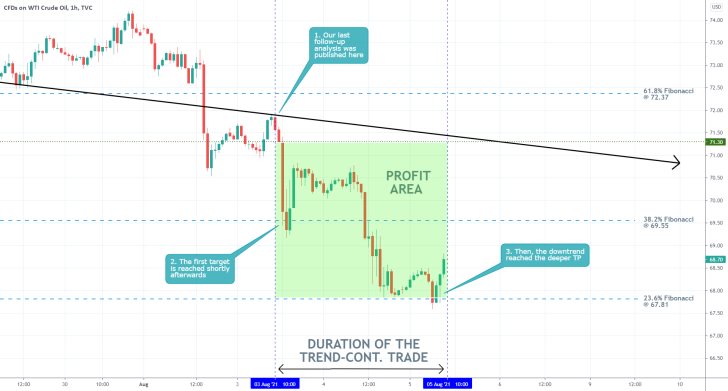
- Our last follow-up analysis of crude oil was a major success. It accurately forecasted a reversal from the descending trend line (in black) and a subsequent dropdown to the 23.6 per cent Fibonacci retracement level at 67.81.
- What made this trade so successful was the timing of its execution, just as the reversal occurred. Moreover, it was also due to the underscoring of the confluence of bearish indicators by the analysis.
- The best trades are always executed when most, if not all, underlying signals point in the same direction.
Disclaimer: Your capital is at risk! Trading and investing on the financial markets carries a significant risk of loss. Each material, shown on this website, is provided for educational purposes only. A perfect, 100% accurate method of analysis does not exist. If you make a decision to trade or invest, based on the information from this website, you will be doing it at your own risk. Under no circumstances is Trendsharks responsible for any capital losses or damages you might suffer, while using the company’s products and services. For more information read our Terms & Conditions and Risk Disclaimer.


