While the speculative nature of the stock market rally is now being questioned due to its apparent disregard for underlying economic factors, the impact of the recovery process in the energy market is becoming increasingly more pronounced. The price of crude oil, in particular, has registered a remarkable bullish run since late-April, when it plummeted below $0 per barrel for the first time on record.
OPEC+ and OPEC's production cuts are having a discernible effect on the aggregate supply and demand equilibrium in the market, which is what continues to drive the price of crude higher, in a robust bullish uptrend. There is a discernible difference between the determinants of the stock market rally, which is prompted mostly by investors' fears of missing out, and the crude oil rally, which is backed up by sound economic factors.
With that crucial difference in mind, the purpose of today's analysis is to examine crude's price action and to outline the most important levels of support and resistance as the uptrend progresses. At present, it seems as though the bullish market is here to stay, but even still, sizable bearish corrections can emerge. That is why we are also going to outline the conditions under which bullish traders can enter the market, as well as the times it would be better for them to sit and wait for a new swing low to be developed.
1. Long-Term Outlook:
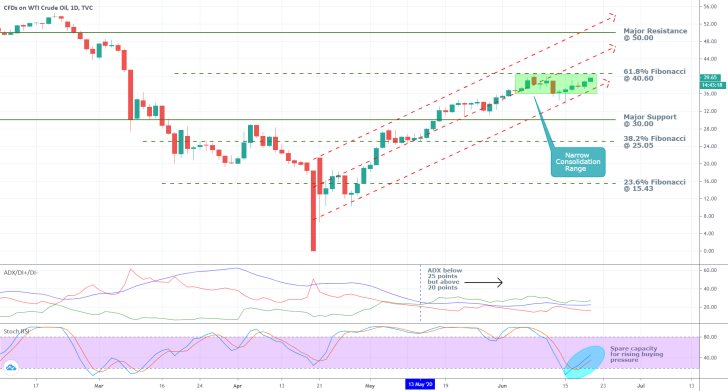
As can be seen on the daily chart below, crude's bullish run is represented by three ascending trend lines, which comprise a single bullish channel. At present, the price action is contained within the channel's lower boundary and its middle line. Additionally, crude's price is consolidating below the 61.8 per cent Fibonacci retracement level at 40.60.
All of this means that the present bullish trend is facing its biggest challenge yet, and breaking out above the next resistance level represents a serious obstacle for the underlying bullish commitment. On the one hand, if the bullish trend is to be terminated, then this is most likely going to happen around the current area on the chart.
On the other hand, if the price action does indeed manage to break out above the resistance level, this is going to be a substantial indication of solid bullish commitment in the market. Consequently, the uptrend is likely to be extended further north. The underlying fundamentals (the aforementioned production cuts) favour the latter scenario.

The market is presently range-trading, as demonstrated by the ADX indicator. It fell below the 25-point benchmark shortly after the price action broke out above the 38.2 per cent Fibonacci retracement level, but has remained noticeably close to this important threshold. Overall, the underlying outlook on the market remains tilted towards the bullish side; however, a trend reversal is not entirely implausible.
Meanwhile, the Stochastic RSI has recently rebounded from the 'Oversold' extreme (notice that the price action did not register any sizable dropdowns while the RSI was falling). This implies that there is still a lot of spare capacity for the market to continue going north before it becomes 'Overbought'. This, too, favours the establishment of a breakout above the 61.8 per cent Fibonacci retracement level.
2. Short-Term Outlook:
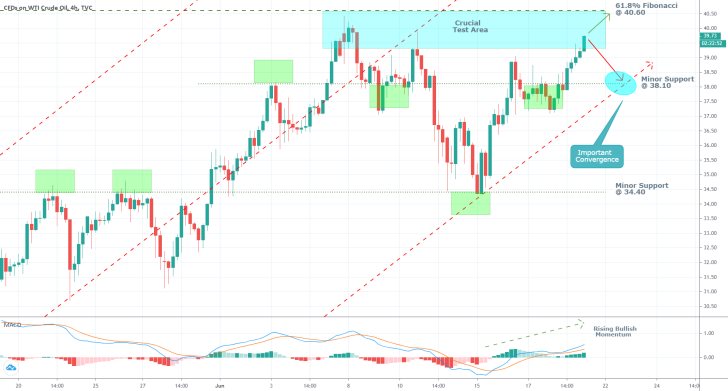
As can be seen on the 4H chart below, the price action is concentrated below the aforementioned resistance and above the minor support level at 38.10. The latter is especially crucial due to the fact that it currently coincides with the broader channel's lower boundary.
Even if the price action fails to break out above the crucial test area and a bearish correction develops subsequently, it could fall to the minor support level at 38.10 before it likely gets terminated. In other words, due to the aforementioned convergence, even if a bearish correction does emerge, it is likely to form a swing low around 38.10. This could be the break in the uptrend's establishment that the market bulls are waiting for, to join the uptrend at a superior level when the price is at a discount.
Meanwhile, the MACD demonstrates rising bullish momentum in the short term. Such behaviour below a crucial resistance level such as the 61.8 per cent Fibonacci retracement implies an early preparation in the market for an eventual attempt at a breakout.

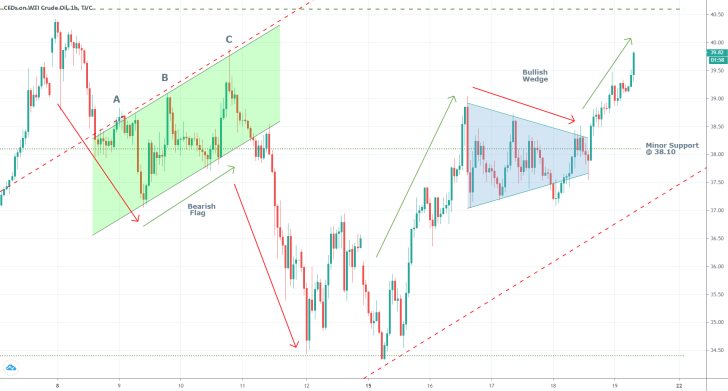
The hourly chart below manifests the changes in the underlying market sentiment in the very short-term. Firstly, the minor downtrend is represented by two bearish impulses that are separated by an intermediate 'Bearish Flag' pattern. Notice the latter's three failed attempts at breaking out above the broader range's middle line (points A, B, and C). The downtrend fell to the minor support level at 34.40 before it was terminated.
Subsequently, the minor uptrend started developing from that same level. It is comprised of two bullish impulses, separated by an intermediate 'Bullish Wedge' pattern. Because this minor uptrend is still developing, traders should not execute long orders prematurely at the current market price.
Instead, they should wait for the second bullish impulse to be terminated (presumably around the 61.6 per cent Fibonacci retracement level), before a new bearish correction emerges. Such a correction is going to develop a new swing low, which, in turn, could be used by the bulls to enter the market long at a discount.

3. Concluding Remarks:
The underlying market sentiment remains mostly bullish, which entails a probable continuation of the broader trend's future development. The price action is likely to continue trading beyond the aforementioned major resistance level; however, early entry on the market bears a considerable risk. Instead, traders would do well to sit and wait for a bearish correction to establish a new bottom (potentially around the minor support level at 38.10) before they execute buying orders.
A significant trend reversal is also possible.

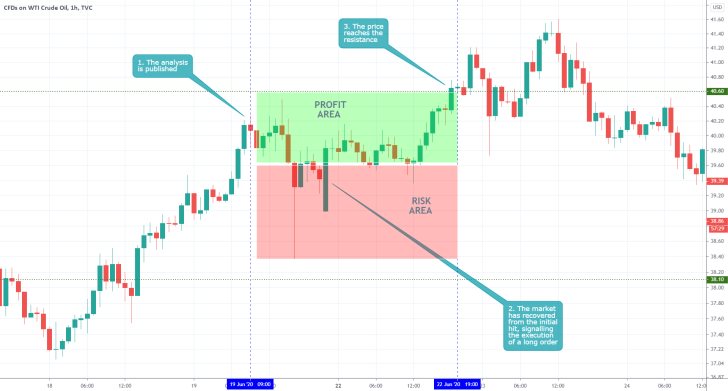
- The analysis did an excellent job of stressing that the market needed to establish a dip in a bearish correction before any long orders could be opened to join the broader bullish trend. Most importantly, traders need to maintain composure and refrain from joining an existing trend at random. Instead, they need to wait for an opportune moment when the price establishes a correction.
Disclaimer: Your capital is at risk! Trading and investing on the financial markets carries a significant risk of loss. Each material, shown on this website, is provided for educational purposes only. A perfect, 100% accurate method of analysis does not exist. If you make a decision to trade or invest, based on the information from this website, you will be doing it at your own risk. Under no circumstances is Trendsharks responsible for any capital losses or damages you might suffer, while using the company’s products and services. For more information read our Terms & Conditions and Risk Disclaimer.


