The price of crude oil's October futures contract tanked on Wednesday by nearly 3 per cent following the latest inventories data in the US. The findings of the weekly petroleum data review for the week ending August 28th confused some traders, which resulted in the massive dropdown.
The Energy Information Administration revealed that crude oil inventories had decreased by 9.4 million barrels, whereas the consensus forecasts were projecting a much smaller contraction of just 2.0 million barrels.
Conventional logic dictates that when the overall supply of barrels in the US oil reserve falls, the price of the precious commodity should go up. So why did it do the exact opposite two days ago?
In such crucially important economic reviews, numbers usually cause sudden ripples in the underlying price action, but it is the subtext against which these numbers are applied to that determines the direction of the market's reaction. In the report itself, it was further stated that:
" U.S. commercial crude oil inventories (excluding those in the Strategic Petroleum Reserve) decreased by 9.4 million barrels from the previous week. At 498.4 million barrels, U.S. crude oil inventories are about 14% above the five year average for this time of year."
So, despite the unexpected reduction in the oil inventories, the aggregate supply remains bigger than usual, and that is why the October futures with a ticker " CLV2020" fell over the past couple of days.
In light of these developments, the price of CLV2020 could be undertaking a new direction. That is why the purpose of today's analysis is to examine in which direction the price of crude could be heading next.
1. Long-Term Outlook:
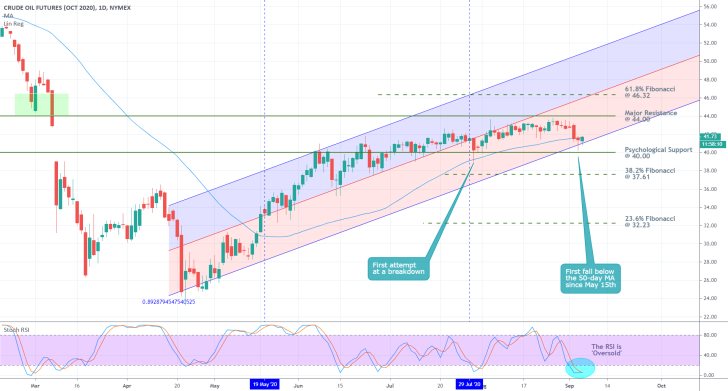
As can be seen on the daily chart below, the underlying price action is currently nearing three crucially important junctions. Firstly, the price action has been contained within the boundaries of a significant range since early-July. The range has the major resistance level at 44.00 as its upper boundary and the psychologically important support level at 40.00 as its lower boundary.
Needless to say, the latter represents a significant psychological barrier, which could set the beginning of a new trend if it gets broken. Yesterday's price action nearly reached it, which could be interpreted as an early signal of mounting bearish pressure in the market.
Secondly, the price of CLV2020 has been advancing within the area of a broader ascending channel since the market started recovering from the initial coronavirus crash in early-March. More importantly, yesterday was the first instance that the price action tested the channel's lower limit, which is yet another indication of accumulating bearish bias.
Thirdly, the price action managed to fall below the 50-day MA (in blue) yesterday for the first time since the 19th of May. This represents the final piece of evidence that is congruent with the assertion that the market is experiencing more selling pressure.

Several things require close consideration here given the aforementioned developments. The price action had been advancing within the upper part of the ascending channel from the 19th of May until the 29th of July. Afterwards, it broke down within its lower area, consolidated below the channel's middle line, and is currently testing the channel's lower limit.
Despite today's minor retracement, the price action continues to trade quite close to this floating support. Even on the condition that it manages to break down below the channel, the price action would still have to test the psychologically important support at 40.00, which represents the most substantial test for the currently developing bearish correction. Breaking below it would require substantial bearish commitment in the market.
Notice that the Stochastic RSI indicator is currently threading within the 'Oversold' extreme. Given the ostensibly ranging conditions of the market, this is likely to prompt more bulls to place long orders around the current swing low, on the anticipation that the range-trading sentiment would persist, and that the price action would rebound. In other words, both bears and bulls should observe how the price action behaves next around the 50-day MA, the channel's lower edge, and the psychological support at 40.00.
2. Short-Term Outlook:
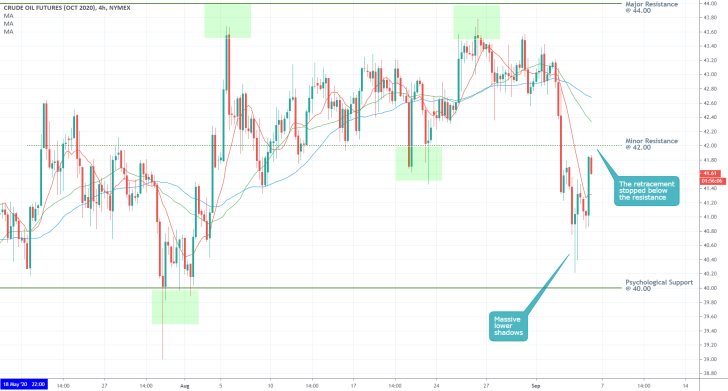
The 4H chart below demonstrates the immediate follow-up to Wednesday's major dropdown. The massive lower shadows of the candles following that dropdown indicate uncertainty in the market. Chiefly, the strong bullish pressure above the 40.00 threshold is, at least for the time being, keeping the price action away from the support.
While the 10-day MA (in red) is trading below the 30-day MA (in green), which, in turn, is positioned below the 50-day MA (in blue), today's retracement broke the perfect descending order. The price action broke above the 10-day MA, which elucidates the remaining buying pressure in the market, despite the increasing bearish sentiment.
Nevertheless, the price action appears incapable of carrying the retracement past the minor resistance level at 42.00, which could be perceived as an indication that it could be ready to attempt a new dropdown. Keep in mind that such sudden changes in the direction of the price action are typical for range-trading market environments.

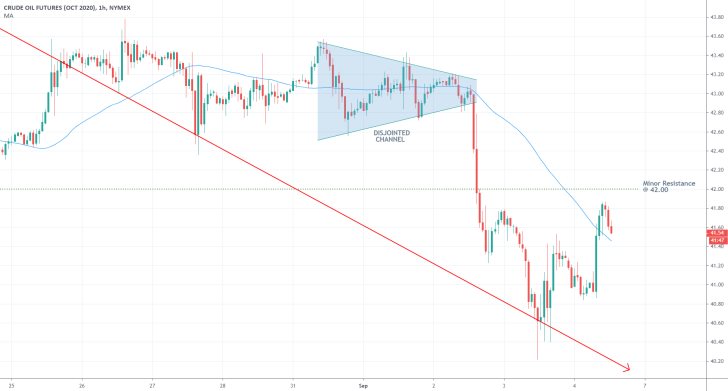
Finally, the hourly chart below demonstrates the early stages in the development of the aforementioned dropdown. It was initiated after the price action broke down below the lower edge of the disjointed channel. Subsequently, the price action rebounded from the descending trend line to go on and establish the retracement.
Notice that this retracement appears to have already established a swing high, which is positioned way below the disjointed channel. This means that the bearish momentum is rising and that the price action is likely to continue heading lower in the near term.

3. Concluding Remarks:
Crude oil's October futures contract continues to be ranging, which means that the price action is prone to bouncing between the prevailing range's boundaries. Swing traders can exploit this by looking for a likely continuation of the current downswing's establishment towards the range's lower limit – the psychologically important support level at 40.00. However, given these range-trading conditions, swing traders should be ready for sudden and adverse fluctuations of the price action.

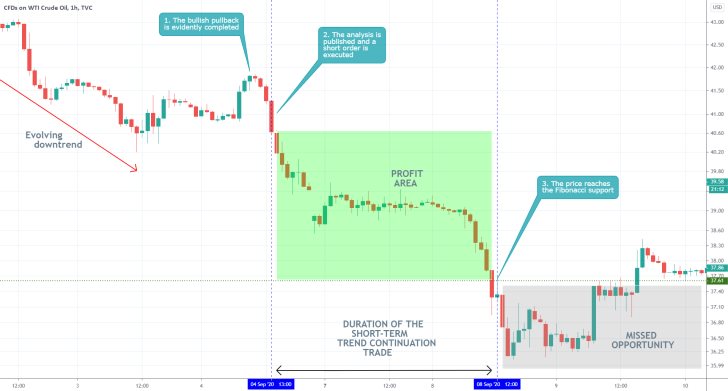
- The analysis had very good reading of the market sentiment at the time of publication. Chiefly, expecting the downtrend to be continued. What it lacked was precision – the price broke down below the two supports unexpectedly, which exceeded the expectations of the analysis. Traders need to have a plan for what to do in case that the price goes beyond their projections, so that they do not miss out from such unexpected trading opportunities.
Disclaimer: Your capital is at risk! Trading and investing on the financial markets carries a significant risk of loss. Each material, shown on this website, is provided for educational purposes only. A perfect, 100% accurate method of analysis does not exist. If you make a decision to trade or invest, based on the information from this website, you will be doing it at your own risk. Under no circumstances is Trendsharks responsible for any capital losses or damages you might suffer, while using the company’s products and services. For more information read our Terms & Conditions and Risk Disclaimer.


