While the world holds its breath to see who will win the US Presidency, as the outcome of the election still hangs on a knife's edge, the energy market is concerned with one primary issue at the moment. At the time of writing this analysis, Joe Biden has garnered 264 electoral votes and needs only six more to secure his victory.
The democrat holds a minor lead in Nevada, says he feels confident about flipping Pennsylvania, and could even snatch a surprising last-minute victory in Georgia, which is a Republican stronghold. As of this moment, Joe Biden boasts a lead of over three million votes over Donald Trump across all states, and by all accounts looks poised to win the election.
The market has been bracing for such a turn of events for quite a while, and now it has to discount the probable consequences of a Joe Biden administration in Washington completely. As regards the market for oil futures, market participants have to weigh in on the likely implications of Biden's agenda on the shale industry. Chiefly, his intentions to gradually transition the American economy away from its dependence on fossil fuels as part of the green new deal.
Contrary to Donald Trump's rather shrill challenges to Biden on the matter of shale during the second and third presidential debates, Biden would not be able to disenfranchise the US shale industry overnight, even if he wanted to. Therefore, there should not be any sudden spikes in the underlying supply and demand dynamics within the energy market, which means that crude oil should remain on its current course.
It seems that the coronavirus crisis is the only external factor that could have any drastic impact on the demand for crude oil in the immediate future. Primarily, the reintroduction of stricter containment measures across the world seems poised to slash the aggregate demand for the precious commodity, which should drive the price of the December futures lower. This impact is likely to become even more pronounced as the adverse volatility stemming from the uncertainty of the election starts to wane down.
1. Long-Term Outlook:
As can be seen on the daily chart below, the newly emerging downtrend is still not very pronounced, which caused the recent bullish correction. Even still, the overall market sentiment remains ostensibly bearish.
The ADX indicator has been threading below the 25-point benchmark since the 18th of December, which means that the market is technically still range-trading. Due to this fact, the bulls saw an opportunity to bet on a likely correction from the psychologically significant support at 33.88, which is the 38.2 per cent Fibonacci retracement level. These expectations were substantiated by the fact that the Stochastic RSI was at its 'Oversold' extreme at that time, which implies a possible reversal when the market is ranging.
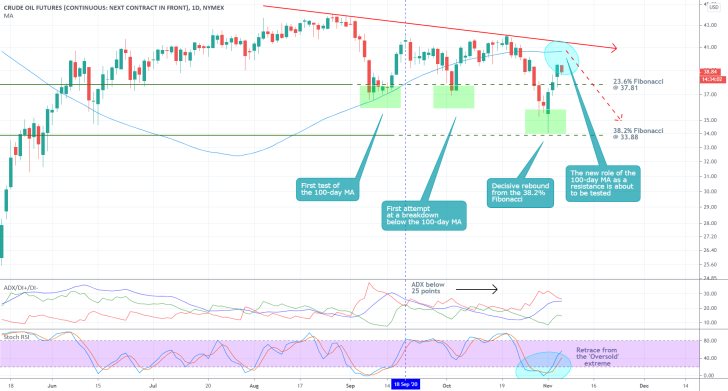
The current bullish correction, however, is very likely to be coming to an end. The fundamental explanation for this is the aforementioned waning volatility connected to the election outcome; whereas the technical reason has to do with the relationship of the price action to the 100-day MA (in blue).
As can be seen, this will be the first time that the price action would be testing the moving average from below, meaning that the latter has adopted a new role – a floating resistance. As such, it functions as a crucially important turning point for the direction of the price action. Moreover, the 100-day MA is currently converging towards the descending trend line, which represents another key resistance barrier.
If the price action does indeed rebound from the two, then the first target level for the reinstated bearish momentum would be the 23.6 per cent Fibonacci retracement level at 37.81. Naturally, should it manage to break down below the latter, the next target level for the price action would be the above-mentioned 38.2 per cent Fibonacci.
2. Short-Term Outlook:
The 4H chart below demonstrates the ways in which the remaining bullish commitment is likely to be exhausted. As can be seen, the price action is currently contained within the 100-day MA and the 50-day MA (in green), which is converging towards the 23.6 per cent Fibonacci. This means that there is a high probability for fluctuations to occur within this range in the near future.
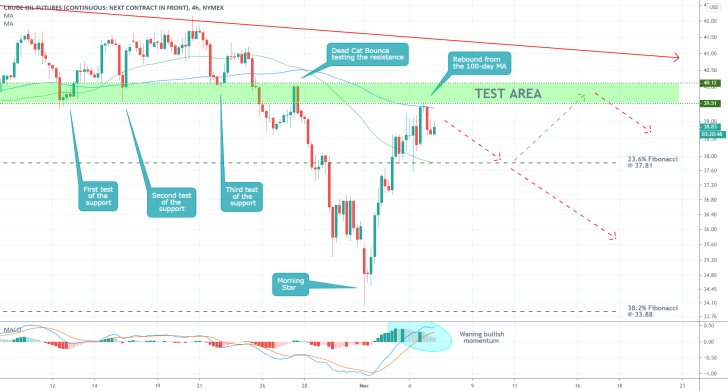
The MACD indicator underpins the decreasing bullish momentum, which implies the possibility of a new reversal. However, before the price action was to change directions decisively, it still has enough bullish pressure remaining to reach the Test Area in green.
The boundaries of the Test Area – 39.51 and 40.12 – are determined by the previous swing lows and swing highs, as is demonstrated on the chart. In other words, the bears might have to wait a little longer before a decisive reversal develops fully.
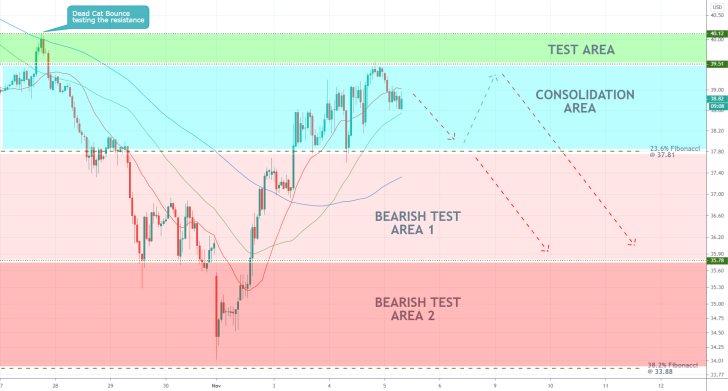
The hourly chart below demonstrates the potential scenarios under which a reversal is likely to take place. While the price action remains concentrated within the Consolidation Area, its bias would remain neutral, meaning that neither bulls nor bears would have full control.
The Test Area is, as was mentioned earlier, the last possibility for a reversal. At the same time, a definitive breakdown below the 23.6 per cent Fibonacci within the Bearish Test Area 1 would imply that the bears have regained control.
3. Concluding Remarks:
The underlying market setup is favourable for the implementation of trend-reversal strategies by bears, who would have to wait for definite signs of exhaustion of the remaining bullish pressure. Such strategies should focus on longer-term opportunities, as entailed by the daily chart above.
Meanwhile, the bulls could look for trend-continuation opportunities in the short-term, provided that the price action rebounds from the 23.6 per cent Fibonacci following a minor bearish pullback.
Time for Crude to Take a Small Detour
The price of crude was greatly affected by the recent Pfizer and BioNTeck vaccine news. The market welcomed these promising news with great excitement primarily with the presumption that an effective vaccine by the end of the year would allow global economic output to pick up without the need for further disruptions due to containment restrictions.
We have already outlined all of the reasons as to why this may not be the case in the next following weeks, but at any rate, the market continues to behave as if global demand is no longer in peril. This reinvigorated enthusiasm amongst investors is having a positive spillover effect on the energy market, which correlates to heightened demand for oil. The general market assumption is simple – a vaccine will allow governments to tackle the pandemic without closing down their economies any more, which, in turn, will not impede the demand for oil in the medium term.
There are plenty of logistical obstacles standing in the way of such an over-optimistic scenario unfolding; nevertheless, for as long as the market keeps on believing this, the demand for crude is likely to remain high. If this excitement starts to wane, however, the price of the commodity could start tumbling as per the initial expectations of the analysis. So, what is the current technical outlook like?
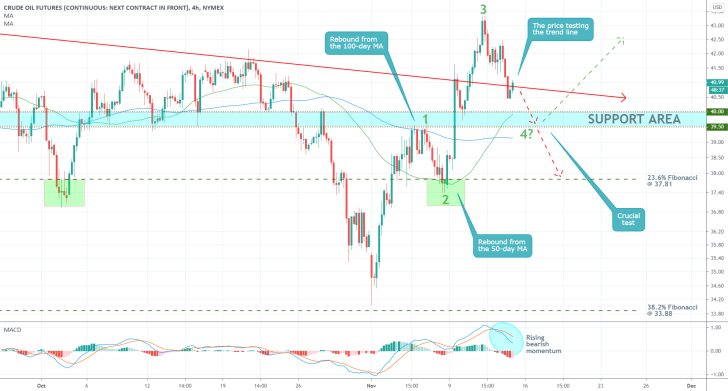
As can be seen on the 4H chart above, the underlying price action of oil is currently in the process of establishing a bullish 1-5 impulse wave pattern, as postulated by the Elliott Wave Theory. Notice that after in concluded developing the second impulse leg (2-3), the subsequent retracement fell back below the descending trend line (in red).
It is especially important to continue monitoring the behaviour of the price action around this trend line because if the price action fails to break out above it again, this will invalidate the further development of the bullish 1-5 pattern. Market bears will be looking for such signals to justify the execution of potential trend-reversal trades.
Conversely, market bulls would be looking for opportunities to join the currently emerging uptrend by going long after the second retracement leg of the pattern (3-4) is completed. Such trend-continuation strategies would allow them to ride the current market enthusiasm and target the final impulse leg (4-5).
Given how the price action behaved with the 100-day MA (in blue) while establishing the peak at 1, and the 23.6 per cent Fibonacci at 37.81 combined with the 50-day MA (in green) while it was setting the dip at 2, gives us an approximate area where a new dip at 4 can be reached – the support area. In other words, market bulls would be looking for an opportunity to use trend-continuation strategies around 40.00 and 39.50, provided that there are decisive signs of another bullish rebound there.
The currently rising bearish momentum, as demonstrated by the MACD indicator, confirms the likelihood for the development of a 3-4 retracement leg. If the price action does rebound within the support area, the final impulse leg (4-5) is likely to be concluded anywhere above the peak at 4. Conversely, if the price action does break down below the support area, it is expected to test the strength of the 23.6 per cent Fibonacci next.
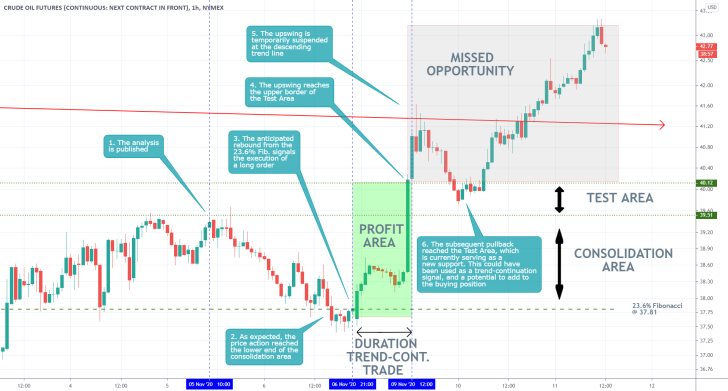
- Even though the price action behaved mostly as expected by the analysis – it reached the lower end of the consolidation area after its publication – the subsequent rebound, which was also forecasted, far outstripped the early projections, which resulted in suboptimal profits. The massive upswing was caused by the recent vaccine news, which invalidated at least temporarily the demand projections of the analysis – an unexpected development.
- Even though the initial analysis could not have forecasted the impact of this news beforehand, it is still worthwhile to notice the behaviour of the price action around the descending trend line and the Test Area, which adopted a new role of a major support. The above setup underscores the need for traders to keep monitoring the fundamental developments in the market constantly. The rebound from the Test Area could have been used as a trend-continuation opportunity.
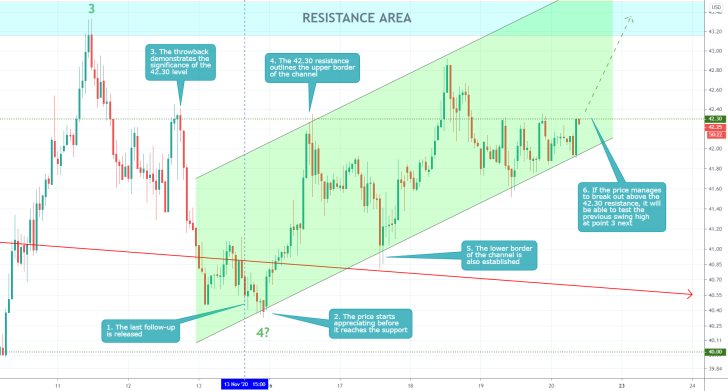
- Shortly after the publication of the last follow-up, the price action broke out above the descending trend line (in red) and started appreciating, as per the expectations. In doing so, the price action resumed developing the broader 1-5 impulse wave pattern, which entails further gains in the near future.
- As can be seen, the price is currently consolidating below the 42.30 resistance and the lower boundary of the ascending channel – if it manages to break out above this minor range, the next target would be the 'Resistance Area' in blue, which is where the last swing high at point 3 was established.
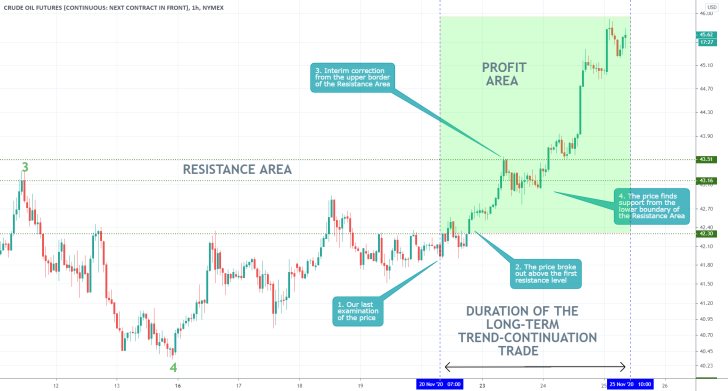
- Another massively successful forecast! The expectations of our last follow-up, complemented by a subsequent journal entry, were quite precise. As can be seen from the hourly chart above, after breaking out above the 42.30 resistance, the price consolidated momentarily around the Resistance Area before continuing to climb higher.
- The biggest outtake from this trade is the importance to recalibrate your forecasts when there is new evidence suggesting that the underlying market sentiment has changed. As you remember, the initial analysis anticipated the price to continue falling due to weak global demand; but that was before all of the vaccine news. Inexperienced traders would have neglected the changing market environment and would have likely kept their selling orders going resulting in massive losses.
Disclaimer: Your capital is at risk! Trading and investing on the financial markets carries a significant risk of loss. Each material, shown on this website, is provided for educational purposes only. A perfect, 100% accurate method of analysis does not exist. If you make a decision to trade or invest, based on the information from this website, you will be doing it at your own risk. Under no circumstances is Trendsharks responsible for any capital losses or damages you might suffer, while using the company’s products and services. For more information read our Terms & Conditions and Risk Disclaimer.


