Energy prices have been falling over the last few weeks on weaker global demand and the rising value of the dollar, which also prompted the price of natural gas to slide. E-mini natural gas futures with expiry in October (QGV2020), in particular, have been tumbling since late-August.
Nevertheless, the longer-term market sentiment remains ostensibly bullish, which means that the price may yet rebound after the bearish bias in the short-term is fully exhausted.
Due to the impact of market seasonality, the price of natural gas typically rises in October and November. The weight of the seasonality factor is likely to be especially bolstered this year due to the coronavirus pandemic, and the expectations for a second wave.
The number of COVID-19 cases continues to rise in the US, Europe, Brazil, and elsewhere. Most authorities in these places could decide to reintroduce stricter containment measures in order to curb the rate of spread, which would mean more people staying at home over the winter months.
Consequently, the demand for natural gas is probably going to surge during the coldest months of 2020, more so than it did last year, as more people are expected to isolate themselves at that time. Natural gas futures are therefore more than likely to rise drastically in the following months.
1. Long-Term Outlook:
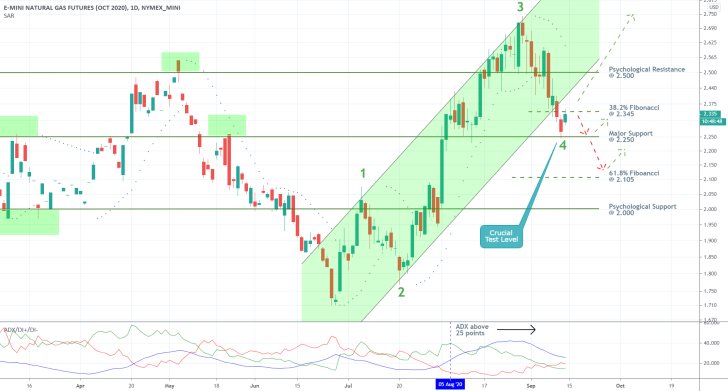
The current bullish run of the natural gas futures with expiry in October began in early July, and the first more significant bearish correction was initiated on the 28th of August. As can be seen on the daily chart below, the price action broke down below the lower boundary of the ascending channel, which signifies the strength of the underlying bearish bias in the short-term.
Nevertheless, the overall market sentiment remains bullish, which entails trend continuation trading opportunities. In other words, swing traders can join the bullish trend by executing long orders once the price action reaches a new swing low and becomes ready to resume trading further north. Such a market setup would entail the continuation of the bullish 1-5 impulse wave pattern, as postulated by the Elliott Wave Theory.
The price action is currently establishing the second retracement leg (3-4). Once this leg is created, the price would be ready to move on to develop the final impulse leg (4-5), which should drive the price action towards new highs. Before this happens, however, the 3-4 retracement leg has to reach a fresh dip.
Last Friday, the price action rebounded from the major support level at 2.250. The prominence of this level has been confirmed at least on two previous occasions, seeing as how the price action had rebounded from it. That is why a potential consolidation of the price action above this support seems like the most probable outcome before it resumes trading higher. Yet, several other possibilities necessitate closer consideration as well.
Today's retracement is currently struggling to break out above the 38.2 per cent Fibonacci retracement level at 2.345. If it fails to do so, the price action would be more than likely to slide towards the major support at 2.250 once again. On the condition that the short-term bearish bias continues to accumulate until then, a potential breakdown below the support would mean that the price action could continue plummeting towards the 61.8 per cent Fibonacci retracement level at 2.105.

The strength of the bearish momentum can be inferred from the Parabolic SAR indicator, which delineates the current direction of the market. Meanwhile, the ADX indicator has been threading above the 25-point level since the 5th of August, which means that the market continues to be trending.
2. Short-Term Outlook:
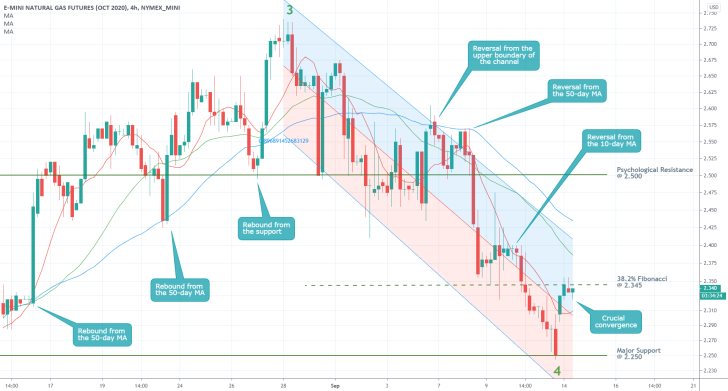
As can be seen on the 4H chart below, the bulls have started challenging the bearish pressure in the market since today's open. First of all, the price action broke out above the regression channel's middle line. This represents an early signal of mounting bullish bias in the market; however, it does not necessarily entail a full reversal. The price action had already reverted itself on three separate occasions after having penetrated the upper part of the channel.
In addition to the aforementioned breakout, the price action is also notably trading above the 10-day MA (in red) at present. Thereby, the price action looks ready to consolidate in a narrow range between the 38.2 per cent Fibonacci at 2.345 and the 10-MA, which currently coincides with the channel's middle line around 2.300. Any breakout/breakdown outside this range spanning between 2.345 and 2.300 would likely signify the next direction for the price action.
The price action would have to break out above the 30-day MA (in green), and the 50-day MA (in blue) before the bulls regain full control. Accordingly, the three moving averages would have to adopt an ascending order amongst each other before the prevalence of the underlying bullish sentiment could be fully asserted.

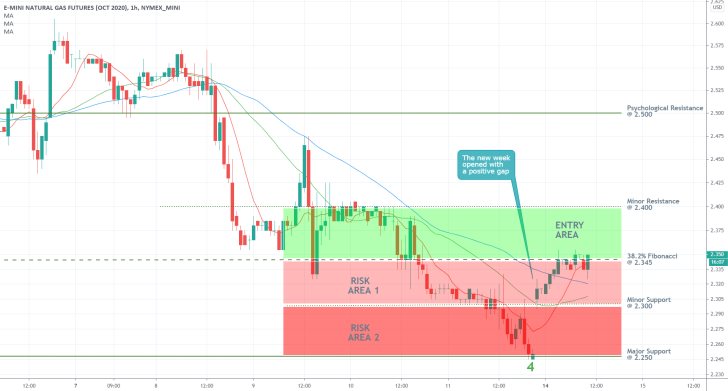
The hourly chart below illustrates the areas of interest for swing traders looking to enter the market long at the swing low. The area between the minor resistance at 2.400 and the 38.2 per cent Fibonacci is where, ideally, the bulls should look to enter long. That is if the price action consolidates above the 38.2 per cent Fibonacci and it does not fall back below this area. The fact that the 10-day MA broke out above the 50-day MA and the 30-day MA is continuing to climb is welcoming news for the bulls.
The risk area 1 represents the threat from adverse fluctuations and potential reversals. If the price action consolidates within it in the near future, this could indicate that the bearish pressure in the market is here to stay. Finally, should the price action fall within the borders of risk area 2, which spans between the major support at 2.250 and the minor support at 2.300, this would mean that the market would continue establishing the bearish correction.

3. Concluding Remarks:
The bulls should not rush to join the market right away as the underlying bearish pressure continues to be affecting the price action in the short run. However, the longer-term forecasts are ostensibly bullish, given the expectations for the surge of demand for natural gas in October and November.
Disclaimer: Your capital is at risk! Trading and investing on the financial markets carries a significant risk of loss. Each material, shown on this website, is provided for educational purposes only. A perfect, 100% accurate method of analysis does not exist. If you make a decision to trade or invest, based on the information from this website, you will be doing it at your own risk. Under no circumstances is Trendsharks responsible for any capital losses or damages you might suffer, while using the company’s products and services. For more information read our Terms & Conditions and Risk Disclaimer.


