Nasdaq's luck seems to be running out as the stock market becomes increasingly more bearish-looking. This could mark the beginning of a new sizable downtrend.
The impact of market seasonality is already playing a pivotal role in diminishing the overall liquidity in the market as the general trading activity falters. Meanwhile, paradoxically as it may seem, improving economic outlook could derail investors' enthusiasm over the next several months.
Yesterday the FED announced plans to lift the Federal Funds Rate in 2023, which sent the dollar rallying. With this more hawkish policy stance of the FED, the end of the massively accommodative QE programme is in sight, though not for another couple of years.
It was precisely the substantial amounts of liquidity that have been pumped into the economy since the beginning of the coronavirus crash that have been fuelling the stock market rally over the same period. Investors and traders took advantage of the easy capital to piggy ride on the resulting market hype.
But now, with the end of the stock market's "happy times" in sight, the general optimism seems poised to falter. And with that in mind, the Nasdaq composite is among the first overbought assets that are likely due for a sizable bearish correction.
The Final Stages of the Triangle
As can be seen on the daily chart below, the price of the Nasdaq has been establishing a Triangle pattern since early March. This type of structure is typically taken to signify potential changes in the underlying direction of the price, which implies a probable reversal.
The price has rebounded from the lower boundary of the Triangle on three separate occasions. It has done the same with its upper limit, too. This means that the price action is likely to test the two limits of the structure at least one more time each before a decisive breakout/breakdown occurs.
Notice that the ADX indicator has been threading below the 25-point benchmark since the 17th of March, which underpins the current range-trading sentiment. Meanwhile, the Stochastic RSI indicator has been threading within its overbought extreme for quite a while now.
Both of these factors combined represent a very strong bearish signal. That is so because the consolidation of the price action following the completion of the previous uptrend signifies the changing market tendencies. The resulting environment is characteristic of probable reversals.
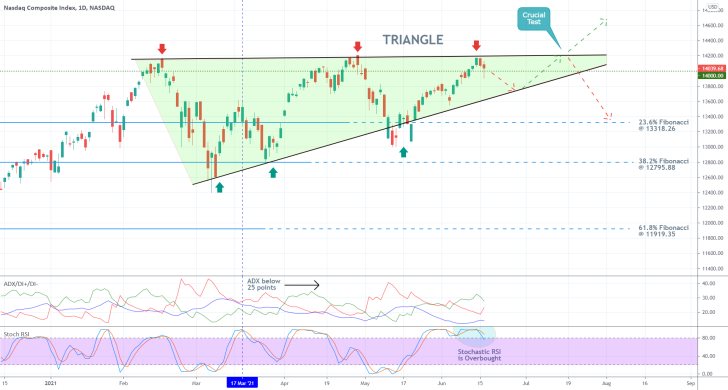
Eventually, if the price action manages to break down below the lower boundary of the Triangle decisively, this would allow for the beginning of a new downtrend. The first major target for it is underpinned by the 23.6 per cent Fibonacci retracement level at 13318.26.
Conversely, if the price continues to consolidate above the psychologically significant support level at 14000.00 and manages to break out above the upper limit of the triangle, this would imply persisting bullish strength.
The Breakdown Play
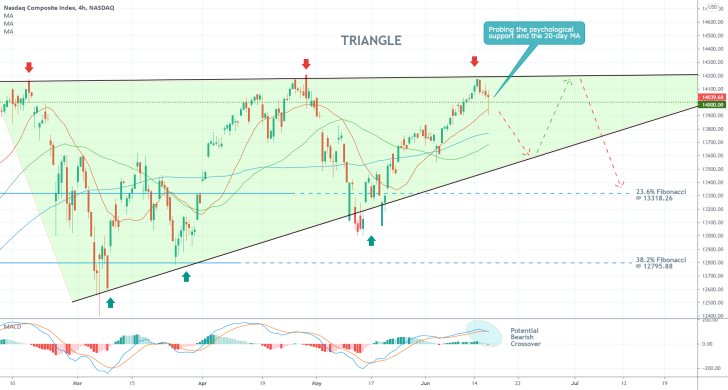
Just yesterday, the price action probed the strength of the resistance-turned-support level at 14000.00, but the daily session was closed by a snap return of the price above this threshold. The resulting Hammer Candle, which also rebounded from the 20-day MA (in red), signifies the remaining bullish bias in the market.
This would continue to be the case for as long as the price action remains concentrated above the perfectly ascending order of the tree moving averages - the 20-day MA threading above the 50-day MA (in green), threading above the 100-day MA (in blue).
Nevertheless, the underlying momentum looks ready to shift in the near future. This is underscored by the MACD indicator, which appears to be in the early stages of a new bearish crossover. This would allow bearish pressure to increase in the short term, likely driving the price action towards the lower boundary of the Triangle for a fourth test.
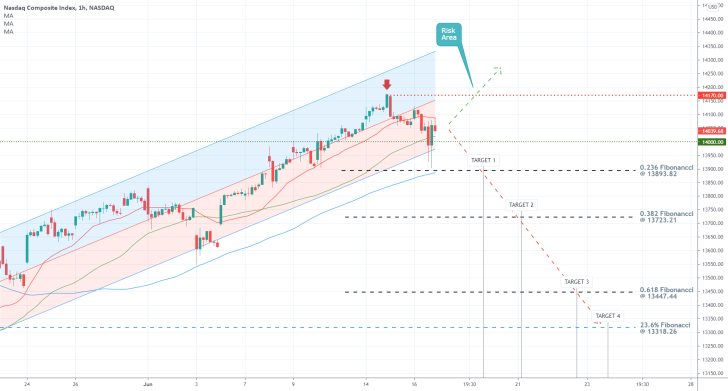
Notice the regression trend on the hourly chart below. The price action has already concentrated within its lower portion, which signifies rising selling pressure in the short term. Moreover, it is consolidating between the 20-day MA and the 50-day MA, while the 100-day MA continues to advance parallel to the channel.
All of this is happening in the vicinity of the psychological support level at 14000.00, which means that the price action is currently finding itself at a major turning point. How the price behaves next would be demonstrative of whether it is ready to start developing the new downtrend right away.
Concluding Remarks:
Bears looking to join the market around the current spot price need to place tight stop-loss orders, not far above the all-time high at 14170.00.
As was stated earlier, the 23.6 per cent Fibonacci retracement level represents the first major bearish target. However, lesser retracements are drawn relative to the last upswing (underpinned by the regression channel). Each one of those represents an intermediate target for sellers.
More risk-averse bears are advised to wait for definite signs of the beginning of the new downtrend. One such sign would entail a decisive breakdown below 14000.00, the channel, the three MAs, and the 0.236 retracement at 13893.82.
Selling Opportunities on Nasdaq's ABCD Pattern
The price of the Nasdaq index continues to probe higher into uncharted territory, though the time for a correction may be soon to come. Before examining what the currently emerging ABCD pattern actually entails, it is important to specify the current market sentiment.
Trading activity has been subsiding for quite a while now as more and more market participants go on their summer holidays. As trading volume diminishes and the underlying liquidity drops, the price action becomes less directional and more erratic.
In other words, the subdued environment is likely to have a negative impact on the Nasdaq, which is about to conclude a major upswing. Under these conditions, the likelihood for the emergence of a bearish correction once this bullish pattern is finished is increased.
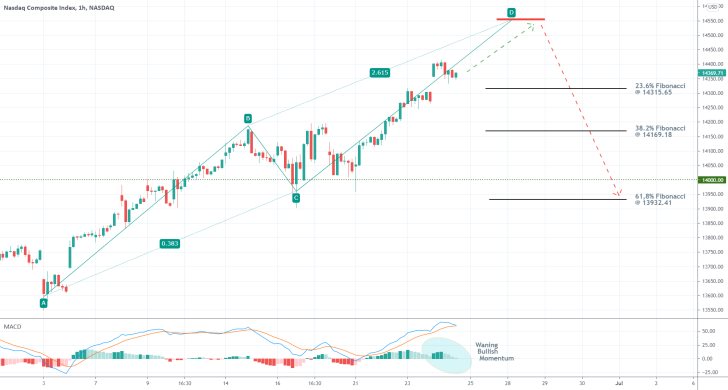
As can be seen on the hourly chart above, the ABCD pattern is still rising towards the expected peak at point D, where the correction is likely to begin. The expectations for a dropdown from 14550.00 are substantiated by the proportionality between the AB, BC, and BD legs of the broader structure.
The initial AB impulse leg was able to break out above the psychologically significant level at 14000.00 decisively. The BC retracement leg was then reversed back to this resistance-turned-support from above. Given the proportionality between AB and BC, a projection can be drawn regarding the likely size of the final CD impulse.
In other words, the ABCD structure is almost completed. This is further substantiated by the fact that the MACD indicator is about to register a bearish crossover. The underlying bullish momentum is waning and almost completely spent. Such a reversal in momentum would be demonstrative of the likely beginning of a new bearish correction.
Bears looking to sell the Nasdaq around 14550.00 can look at several potential targets for the correction. The price could drop to one of the three Fibonacci retracement levels or the psychologically significant support level at 14000.00. They should keep in mind that each one of those could serve as a potential turning point that could terminate the correction there.
That is why bears can substitute their fixed stop-losses for floating stop orders once the price reaches the 23.6 per cent Fibonacci retracement level at 14315.65. That way, they can squeeze the most out of a dropdown below said level while also protect themselves against sudden bullish rebounds there.
The Nasdaq to Break Below the Linear Regression
The price of the Nasdaq composite index has been breaking into uncharted territory over the past several weeks, underpinned by strong buying pressure. However, with each consecutive day of gains, the likelihood of a temporary bearish correction becomes bigger and bigger.
It finally seems that the time for such a dropdown is here. Yesterday, the Federal Reserve in the U.S. published the minutes from the last monetary policy meeting, which catalysed an immediate bearish reaction on the price of the index. That is owing to the increasingly more hawkish policy stance of the Federal Open Market Committee (FOMC).
Finally, another fiscal tightening is on the horizon, albeit not until 2023. This would spell the end of the happy times for the stock market, which is a good enough of a reason for bears to ramp up pressure on the Nasdaq composite.
While these are all developments that will have an imprint on the index in the long term, there are also plenty of reasons to expect a correction in the immediate future.
Primarily, FED's policy minutes from yesterday are likely to catalyse a bigger dive that could be extended after today's open. The low liquidity in the market could also contribute to such a dropdown.
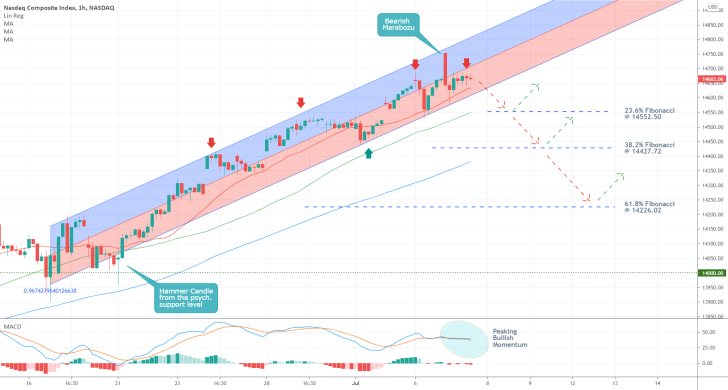
The massive Marabozu candle that emerged following yesterday's market open, as presented on the hourly chart above, was prompted by the FED minutes. Marabozu candles typically underpin mounting selling pressure and likely bearish reversals. This confirms the expectations for a correction in the near future.
The most recent upswing is presented as a regression channel, which commenced following the emergence of a Hammer candle from the psychologically significant support level at 14000.00. Given that such a prominent candle initiated the channel, the development of another candle of equal importance and opposite direction (the Marabozu) implies that the upswing is now likely coming to an end.
The mounting bearish bias is further demonstrated by the fact that the price action is concentrated within the lower portion of the channel, while the MACD indicator signifies the preparation for another bearish crossover.
If the market does not open with a gap at the beginning of today's trading session, bears can utilise contrarian trading strategies near the current spot price. They can place their stop-loss orders just above the Marabozu candle.
If the price action manages to break down below the lower boundary of the channel, which is currently converging with the 20-day MA (in red), it would then probably head towards the 23.6 per cent Fibonacci retracement level at 14552.50. Notice that the latter is about to be crossed by the 50-day MA (in green).
A deeper correction could head towards the 38.2 per cent Fibonacci retracement level, which is converging with the 50-day MA (in green).
Each Fibonacci retracement level serves as a potential turning point, which is further bolstered by the fact that each one of them is currently being crossed by a moving average.
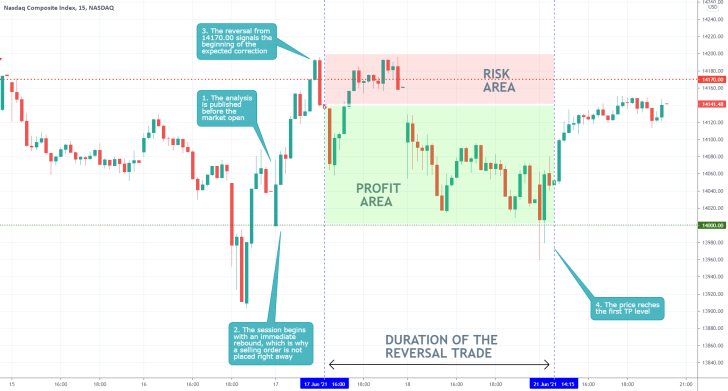
- Shortly after the publication of our last analysis of the Nasdaq, the price action rebounded from the psychologically significant support level at 14000.00. This is why a selling order was not opened right away.
- However, the subsequent reversal from the closest resistance level (at 14170.00) signalled that the price was ready for a correction. As expected, the price reached the first target level (again, the support at 14000.00).
- The second rebound from this major threshold meant that the correction is not yet strong enough to fall deeper.
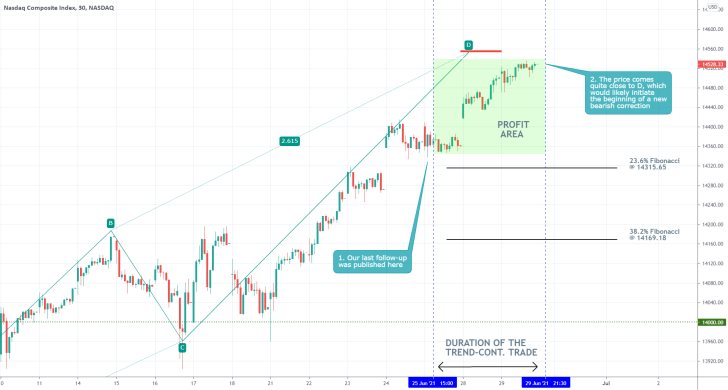
- As projected, the price action continues establishing the final impulse leg of the ABCD pattern. This forecast enabled our last follow-up analysis of the Nasdaq Composite to catch nearly 200 basis points on the upswing, as the price heads towards point D.
- In this case, the execution of a new long order in an established uptrend was warranted because it was carried out towards the bottom of a temporary consolidation.
- Once the price reaches point D, it is likely to begin developing a bearish reversal. This would allow bears to trade on the likely establishment of a new bearish correction.
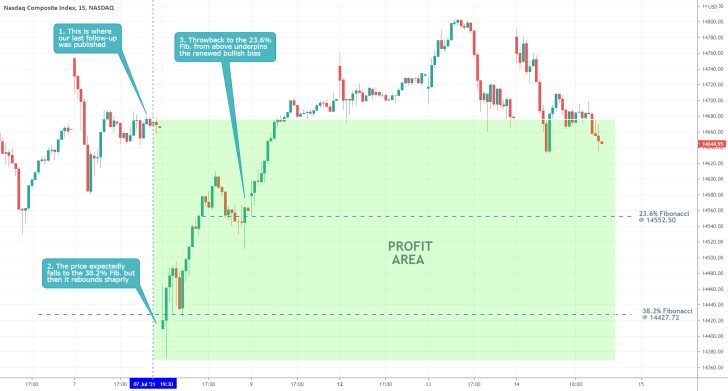
- Another massively successful trade. The last follow-up analysis of the Nasdaq Composite index had excellent timing, being published shortly before the anticipated drop.
- Moreover, the price did fall to the 38.2 per cent Fibonacci retracement level at 14427.72, as was forecasted, before a snap rebound occurred.
Disclaimer: Your capital is at risk! Trading and investing on the financial markets carries a significant risk of loss. Each material, shown on this website, is provided for educational purposes only. A perfect, 100% accurate method of analysis does not exist. If you make a decision to trade or invest, based on the information from this website, you will be doing it at your own risk. Under no circumstances is Trendsharks responsible for any capital losses or damages you might suffer, while using the company’s products and services. For more information read our Terms & Conditions and Risk Disclaimer.


