The Nasdaq composite has been threading in a minor range below the psychologically significant resistance level at 14000.00 since the beginning of May, as underlying volatility in the stocks market gradually subsided.
Instead, more prevalence was given to the commodities market, as a new supercycle is currently in the making and the even more volatile crypto market. This transformational change came just as the impact of market seasonality started becoming increasingly more noticeable - trading activity in the stocks market is diminishing ahead of the summer holidays.
Despite all of this, however, the underlying bullish commitment that drove Nasdaq's latest rally is far from being over. The index is indeed consolidating at present, but this does not necessarily entail a forthcoming reversal. On the contrary, this appears to be an intermittent break in the rally, which would offer bulls the opportunity to join the market in anticipation of future price hikes.
Nasdaq's Bottleneck
As stated above, the price action of the Nasdaq composite is currently consolidating within an increasingly narrower range. As shown on the daily chart below, it is contained above the 100-day MA (in blue) and the 23.6 per cent Fibonacci retracement level at 13338.13, but below the 50-day MA (in green) and the 20-day MA (in red).
This behaviour of the price action implies the possibility for future fluctuations between the ascending trend line (in black) and the psychologically significant resistance level at 14000.00. Nevertheless, some potential cues can be used by bulls seeking to implement trend continuation trading strategies.
They could try to go long near the 23.6 per cent Fibonacci; however, they need to stay aware of potential temporary dropdowns below the trend line (area in green). Accordingly, they should also remain cautious of likely false breakouts above 14000.00. It was because of two false breakouts above this psychological barrier that led to the establishment of the Double Top pattern.
Double tops typically entail potential trend reversals, which should be something to keep in mind. If the price fails to break out above 14000.00 decisively, and a dropdown below 23.6 per cent Fibonacci follows next, this would imply a heightened likelihood of a new downtrend.
The ascending trend line has already held back the price action on four separate occasions, which is why bulls are justified in expecting continued price appreciation. Furthermore, the trend line is also positioned quite close to the 100-day MA and the 23.6 per cent Fibonacci. The convergence of these three crucially important supports confirms the primary bullish expectations. That is why also, a decisive breakdown below the three would represent such a major bearish signal.
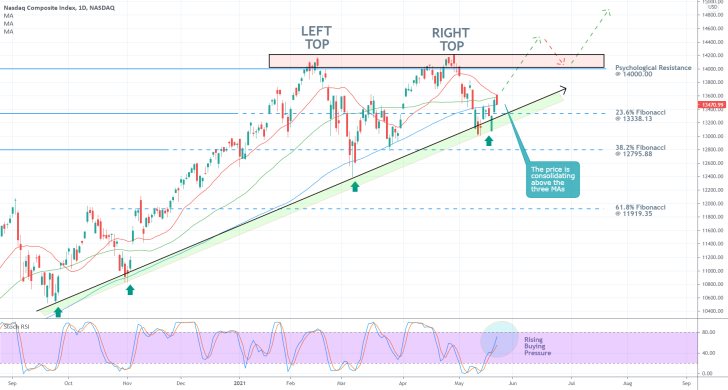
The current reading of the Stochastic RSI indicator elucidates the spare capacity for more buying pressure accumulating over the near future. Given the range-trading conditions in the market, however, this anticipation for additional buying pressure may not lead to a decisive breakout above 14000.00, not at the present rate at least. That is why bears should brace for a potential dropdown to the trend line once the price probes the psychological barrier for the third time.
Once the underlying rally is indeed ready to continue advancing higher, such a breakout is likely to be followed by a minor pullback to 14000.00 (from above, before the Nasdaq continues advancing higher.
More uncertainty ahead
The expectations for additional adverse fluctuations in the short term (before the rally can be extended higher) are substantiated by the several bearish tests that were established recently. The first time that the IXIC probed the 38.2 per cent Fibonacci retracement at 12795.88, the price rebounded from the 200-day MA (in purple), resulting in the development of a Hammer Candle.
The subsequent pullback was exhausted below the 100-day MA. The IXIC went on to test the strength of the 200-day MA once more afterwards before going on to establish the Right Top. Notice that finally, the price managed to break down below the 200-day MA and consolidate below the 23.6 per cent Fibonacci for a little bit.
This trend manifests the gradual accumulation of bearish commitment in the market, which should not be neglected by bulls. The area in green outlines an important make-it-or-break-it range for the Nasdaq, which could make the difference between a continued rally and a bearish reversal.
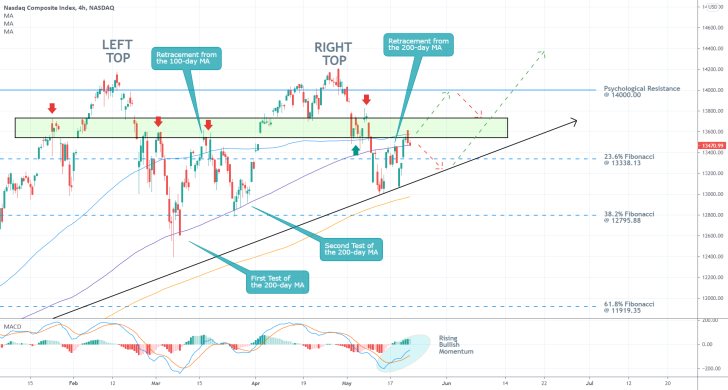
More specifically, if the next test of the 14000.00 resistance is followed by another drop down to the ascending trend line, bulls should perceive this as an indication that the market is not yet ready to resume developing the broader uptrend.
For the time being, however, the short term market momentum appears to be prevailingly bullish. This can be inferred by the bullish crossover on the MACD indicator.
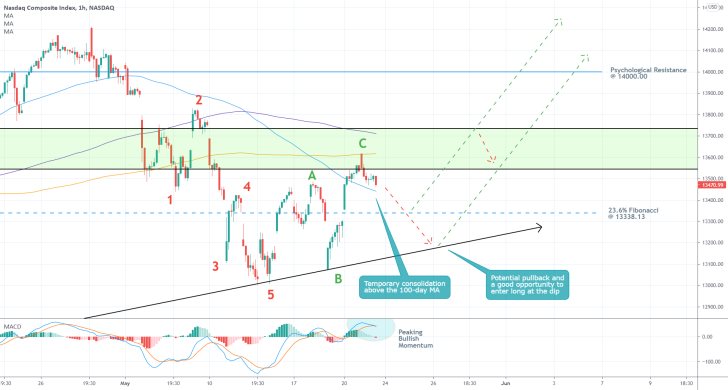
As regards the latest behaviour of the price action, the hourly chart below underpins the completion of an Elliott cycle, as postulated by the Elliott Wave Theory. A bearish 1-5 impulse wave pattern was followed by an ABC correction. This means that the price is ready to start developing a new upswing/downswing immediately.
On the one hand, the price is consolidating above the 100-day MA. On the other, it is also failing to break out above the 300-day MA (in orange) and the lower boundary of the resistance area.
Given that the MACD indicator is also peaking, all of this means that there is not much congruency in the market at present for bulls to open any trades right away. Nevertheless, they should stay alert if they want to get an optimal entry.
Concluding Remarks:
The best thing to do for market bulls, depending on their level of risk-aversion, would be to stay patient and wait for more definite commitment in the market. They can either wait for the price to fall to the ascending trend line yet again before they execute any long orders, or they could wait for an even more definite bullish confirmation.
This would entail buying in at the dip of a throwback that would emerge from the eventual breakout above 14000.00. In other words, more risk-averse traders can try to go long, around 14000.00, after the price falls to this psychological threshold from above.
The Nasdaq to Test the Psychological Resistance at 14000.00 One More Time
The recent behaviour of Nasdaq's price action illustrates growing bullish pressure in the short term, amidst new data underpinning the robust global recovery.
The U.S. manufacturing sector enjoyed record-breaking expansion in May, though today's services numbers are likely to exert an even more substantial impact on stocks.
As regards the technological sector, traders and investors should pay especially close attention to the underlying volatility associated with higher-risk assets. Even with these tribulations in the cryptocurrency market, tech stocks are still in a good place to continue advancing towards the closest psychological resistance.
The 14000.00 level has already caused the price to change directions on two separate occasions (which led to the creation of a Double Top pattern), so it remains to be seen how the price of the IXIC will behave around this all-time high territory on its third attempt to break higher.
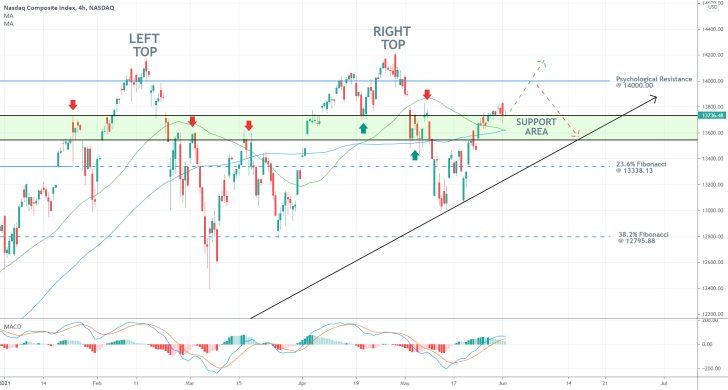
As can be seen on the 4H chart above, the price rebounded from the ascending trend line (in black) recently, before the emergence of the latest upswing. Subsequently, the price broke out above the upper boundary of the Support Area (in green), which underpins the strong bullish commitment in the short term.
An additional confirmation of this is elucidated by the fact that the price action is concentrated above the 50-day MA (in green) and the 100-day MA (in blue). Both of these developments signify the likelihood of continued price appreciation towards the psychologically significant resistance.
Moreover, the MACD indicator is underscoring solid bullish momentum in the market, however, it is decreasing in magnitude. In other words, the underlying momentum remains ostensibly bullish in the short term, but bearish pressure is rising marginally.
Bulls could look to go long near the current market price, however, they need to place their stop-losses no lower than the 50-day MA. Accordingly, they could move their stop orders to a breakeven point (or utilise floating stops instead) once the price reaches 14000.00. That way, they could squeeze the maximum out of a potential appreciation of the price into uncharted territory past this major barrier.
Conversely, bears could look for an opportunity to sell the Nasdaq on the condition that the price fails to break out above 14000.00, and it reverses itself instead. This would allow them to utilise contrarian trading strategies near this historic peak.
Time for an Elliott Correction on the Nasdaq
The Nasdaq Composite closed just below the psychologically significant resistance level at 14000.00 yesterday, as the index was denied a decisive breakout above this crucial boundary. Continued consolidation below the resistance would manifest waning bullish commitment, which, in turn, could signify a new bearish correction.
Stocks have been fluctuating over the past several days, which means that the current opportunity will best serve intraday traders, eyeing smaller price swings, as the broader market sentiment remains relatively neutral.
Currently, the most prevalent factor on the market is seasonality. Market participants start going on their summer holidays, which contributes to diminished liquidity. That is why we are seeing seemingly erratic price fluctuations on most assets.
Nevertheless, the inflation data in the U.S. that is scheduled for publication later today could jolt the Nasdaq just enough to initiate an expected correction. Consumer prices growth is projected to have eased in May, which would benefit the greenback against riskier assets such as the Nasdaq. This trend of slowing inflation was already observed in China.
The timing thus seems perfect for utilising contrarian trading strategies on the index. However, traders should keep in mind that such an approach would entail a high degree of risks when practised in the short term.
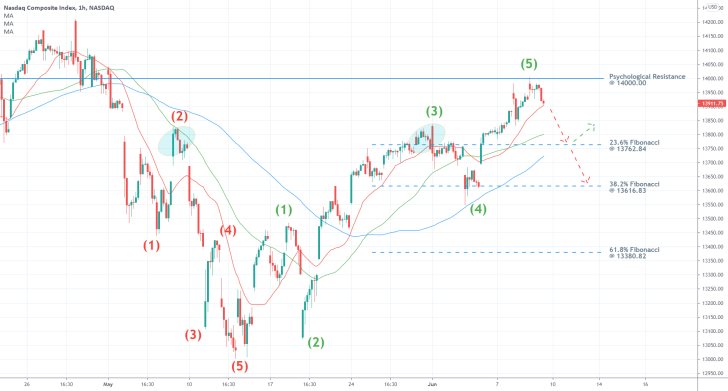
As shown on the hourly chart above, the Nasdaq appears to have completed a 1-5 impulse wave pattern, as postulated by the Elliott Wave Theory, that is peaking at the 14000.00 resistance. This bullish structure followed the preceding 1-5 bearish pattern (in red). Hence, its completion below this psychological resistance underpins the likelihood for another reversal from it.
The most likely target for such a dropdown is encapsulated by the 23.6 per cent Fibonacci retracement level at 13762.84. In addition to its inherent significance as a Fibonacci threshold, it is also about to be crossed by the 100-day MA (in blue), which serves the role of a floating support. Moreover, the 13762.84 level coincides with two previous swing peaks - point 3 (in green) and point 2 (in red) - which elucidates its significance as a major turning point.
If the price manages to break down below the 23.6 per cent Fibonacci, then the correction is likely to be extended further down south towards the 38.2 per cent Fibonacci at 13616.83. The prominence of the latter stems from the fact that it is positioned on the same plane as the bottom of the last retracement leg (3-4) of the bullish 1-5 pattern.
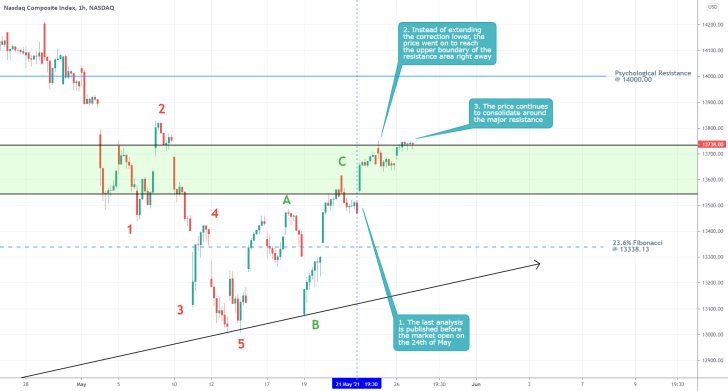
- Even though the analysis is not yielding any results as of yet, the market is generally behaving as per its broader expectations. The only unexpected development was the immediate appreciation of the price shortly after the release of the analysis.
- Even though this precluded (for the time being) the possibility for bulls to enter long at a discount near the 23.6 per cent Fibonacci retracement, the underlying opportunity remains very much active.
- What bulls can do instead is to wait for a potential dropdown to the lower boundary of the resistance area (in green) before they place any buying orders.
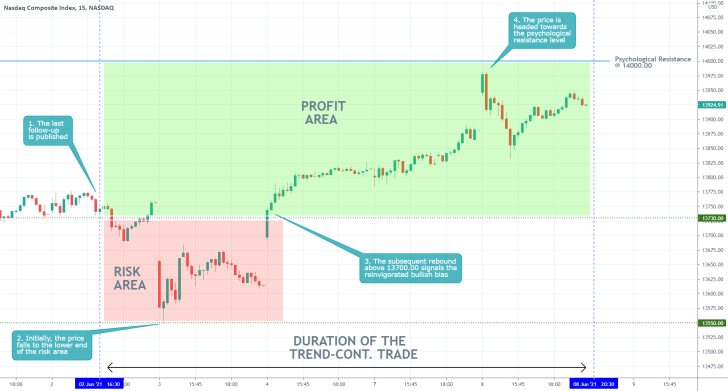
- Even though the last follow-up is so far managing to yield profits, the trade as a whole is considered more of a failure rather than a success. That is so because the incurred loss comprises a huge chunk of the subsequent profit.
- That is why traders need to place tight stop-losses near prominent price levels. Otherwise, they run the risk of incurring even more substantial losses from deeper dropdowns or higher upswings.
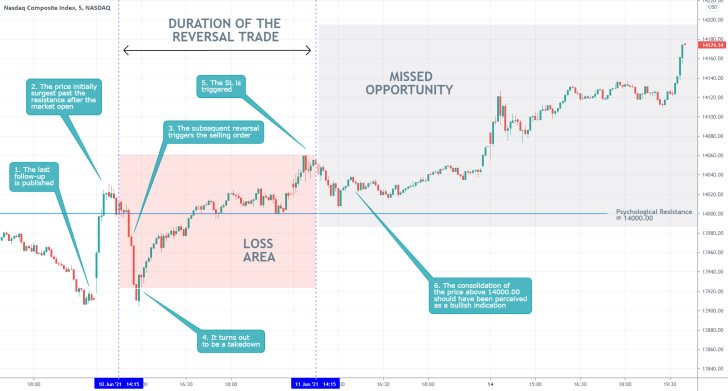
- Shortly after the publication of our last follow-up analysis of the Nasdaq Composite, the price action established a false bearish reversal below the psychologically significant resistance level at 14000.00. This triggered the execution of a contrarian (selling) trade, which incurred a 155 BPs loss from the subsequent rebound.
- Even though the trade incurred such losses, the execution of the trade, on the whole, was mostly justified. Contrarian trading around such major thresholds is logical, and there were enough reasons to justify entry at that particular moment.
- Traders should remember that they can't always be successful. Sometimes it is helpful to take pride in knowing that you have done everything correctly, even if the market has gone against you. This is a good way of dealing with the stress of losing.
Disclaimer: Your capital is at risk! Trading and investing on the financial markets carries a significant risk of loss. Each material, shown on this website, is provided for educational purposes only. A perfect, 100% accurate method of analysis does not exist. If you make a decision to trade or invest, based on the information from this website, you will be doing it at your own risk. Under no circumstances is Trendsharks responsible for any capital losses or damages you might suffer, while using the company’s products and services. For more information read our Terms & Conditions and Risk Disclaimer.


