Since the beginning of March, the Nasdaq Composite has been stabilising after having reached a bottom of a preceding bearish correction. The short-term bullish momentum is presently increasing, however, many unknowns remain. Chiefly, will the recuperating stocks manage to surpass the previous all-time high near 14200.00, or the short-term bullish momentum is nothing more than a temporary break in the development of a new bearish trend.
The relatively subdued market bias as of late, which was brought about by the absence of any major events in the economic calendar over the last couple of weeks, provided a much-needed respite for bulls. In other words, the lack of substantial market conviction allowed stocks to recuperate some of the previous losses.
This process was strengthened by Joe Biden's new fiscal plans coupled with the ongoing vaccine rollout worldwide. Moreover, the expectations for faster-than-initially-projected global recovery have substantiated investors' optimism.
The market appears to have priced in the higher yields in the U.S., which was what inspired the aforementioned correction in the first place. That way, the Nasdaq has been able to shake off the initial bearish pressure. The index is likely to continue rallying in the longer term, depending on how the underlying price action behaves around the all-time record at 14200.00 next.
1. Long-Term Outlook:
As can be seen on the 1D chart below, the Nasdaq Composite peaked just above the psychological resistance at 14000.00 to establish this all-time high. The subsequent correction drove the price action to the 100-day MA (in blue), which currently acts as a floating support. In the wake of this dip, the price of the Nasdaq started creating an ascending channel.
Its lower boundary has been tested on two separate occasions, whereas its upper border has been tested only once. This means that the current upswing is likely to probe the channel's upper limit before another bullish pullback can occur. Such a pullback is therefore likely to emerge either from the psychological resistance at 14000.00 or the historic resistance at 14200.00
Notice that the channel itself appears to be taking the form of a new 1-5 impulse wave pattern, as postulated by the Elliott Wave Theory. It follows that the current upswing (headed towards the upper border of the channel) is underpinned by the second impulse leg (2-3) of the pattern. Once it gets completed, the price action is likely to establish the second retracement leg (3-4).
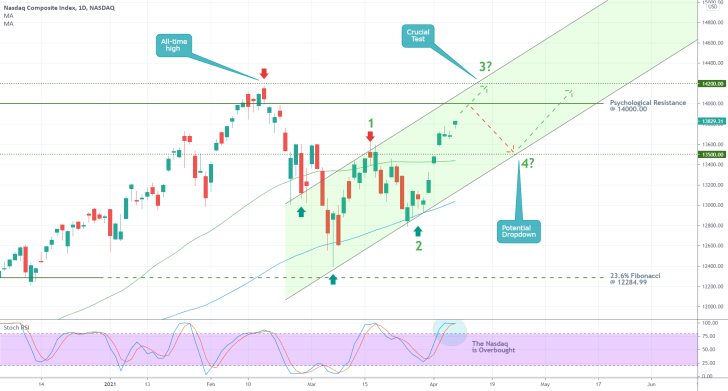
Such a retracement leg is intuitively likely to fall to the channel's lower boundary, possibly to the 13500.00 support level. The latter served as the highest point of the first impulse leg (0-1) of the Elliott pattern, which makes it a prominent resistance-turned-support. Moreover, it is currently converging with the 50-day MA (in green), which makes it an even more prominent turning point.
Overall, the price of the Nasdaq is likely to continue establishing the current upswing (impulse leg) for a little while more -possibly climbing an additional 200-400 basis points from the current price - before a bearish correction to the lower boundary of the channel takes place. These expectations are also substantiated by the fact that a significant selling pressure is likely to be found just above the all-time high, which would mean that the price would be prone to fluctuate for a little while longer before the rally can be extended into uncharted territory.
Notice that the Stochastic RSI indicator is currently threading in its Overbought extreme. Even though this does not necessarily imply an immediate dropdown, it does underpin the likelihood for an eventual correction in the near future.
2. Long-Term Outlook:
The 4H chart below examines the 1-5 impulse pattern (in green) in greater detail. Each separate impulse and retracement leg represents smaller Elliott patterns in itself. The first impulse leg (0-1) is comprised of a smaller 1-5 Elliott wave pattern, whereas the retracement leg (1-2) is manifested by a corrective ABC. This means that the current upswing (the second impulse leg 2-3) is also likely to represent a 1-5 impulse wave pattern.
Consequently, once the final impulse leg ((4)-(5)) of this smaller pattern is completed - conceivably around one of the two major resistances - the second retracement leg (3-4) of the broader Elliott pattern would be ready to begin developing. As stated earlier, this retracement leg is likely to head towards the lower boundary of the channel, around 13500.00. The MACD indicator signifies this.
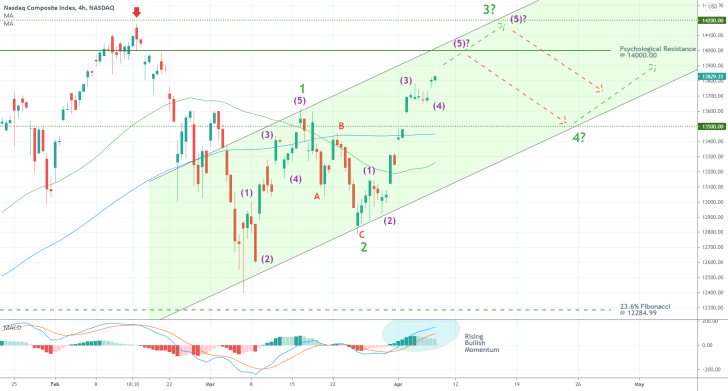
While bulls can try to catch the final portion of the current upswing, going long at this late stage in the development of the upswing would likely entail more risk than potential gains. Instead, more risk-averse bulls can wait for the establishment of the next retracement leg (3-4) of the broader pattern before they can use trend continuation trading strategies.
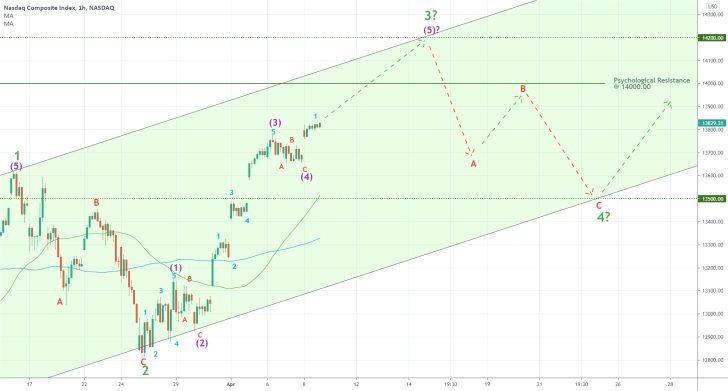
In contrast, market bears can try to implement contrarian trading strategies once the broader impulse leg (2-3) is completed, conceivably somewhere close to the channel's upper boundary. They will be eyeing a likely dropdown to point 4 (in green). This dropdown is likely to take the form of an ABC correction, which would allow bears to add up to their selling orders near point B (in red), potentially close to the psychological resistance at 14000.00.
3. Concluding Remarks:
The Nasdaq Composite is overall likely to continue heading into uncharted territory, past the previous all-time high, in the long term. However, before the rally can be extended further north, the underlying price action is likely to continue fluctuating around the psychologically significant resistance level at 1.40000.
Nasdaq's Bearish Butterfly Entails Rising Selling Pressure
The Nasdaq composite index is currently attempting to break out above the psychologically significant resistance level at 14000.00 decidedly. This represents the third such attempt after two failed attempts.
The index is currently rising amidst the ongoing earnings season in the U.S., which is causing heightened investors' optimism. Some of the most popular tech giants in the world, such as Tesla, Apple, Microsoft, and Amazon, are set to post their quarterly earnings this week, which is likely to strengthen the bullish momentum currently seen on the Nasdaq composite.
The present earnings season has already seen some robust performances by major blue-chip companies, which bolsters the likelihood of continued price appreciation. Nevertheless, this momentary bullish sentiment may not be enough to sustain the rally in the longer term.
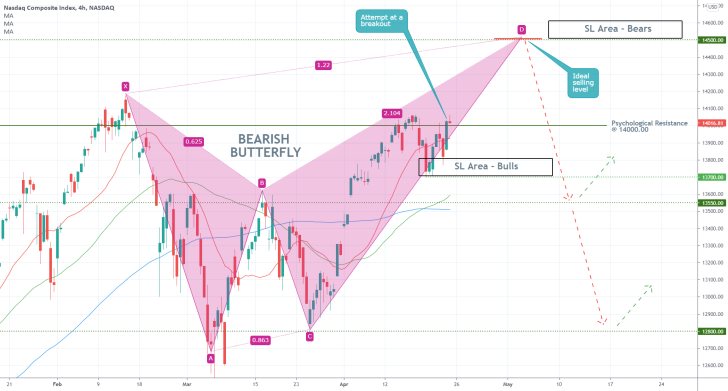
As can be seen on the 4H chart above, a potential confirmation of such a breakout past 14000.00 would allow market bulls to join the existing uptrend. They can open long orders just above this crucial resistance while placing their stop-loss orders around the dip of the last bearish pullback (around 13700.00). The significance of the latter is also confirmed by the fact that the 20-day MA (in red) is currently threading around it.
Notice also that the IXIS is currently developing a major Bearish Butterfly pattern, which signifies the likely upcoming termination of the underlying uptrend. This could happen around the semi-psychological resistance level at 14500.00, which is where bulls should consider closing their buying positions. In contrast, market bears can look for an opportunity to start selling around the same level.
Naturally, the SL area just above 14500.00 outlines the risk area for bears looking to catch such a reversal. On the flip side, they face an outstanding risk/reward outlook ratio for such a trade.
The major support level at 13550.00 (previous swing high) encompasses the first target for such a correction, whereas the bottom of the Butterfly (around 12800.00) underpins a deeper target.
Tech Stocks Continue to Reel from Mounting Inflation Fears
The Nasdaq composite was hit recently by mounting investors' fears concerning soaring inflation. These fears were materialised yesterday when it was revealed that U.S. headline inflation more than doubled in April alone. Thus, the equities turmoil was exacerbated, as inflation is promptly becoming an impediment to recovery rather than its catalysis.
The FED might have to intervene soon and reduce the levels of monetary policy support, which is likely to bolster the bearish pressure on tech stocks. The question is, how low could the Nasdaq sink before the crash bottoms out?
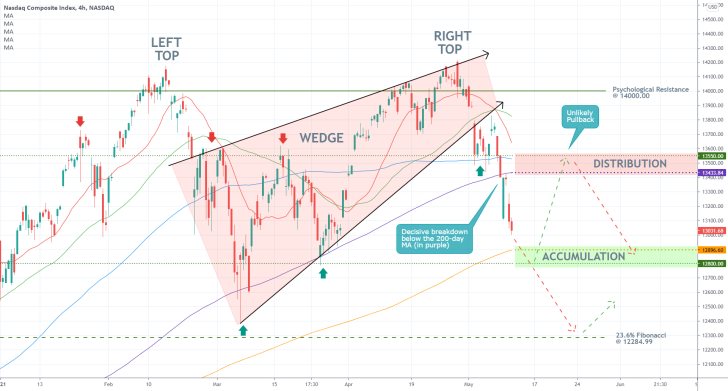
As can be seen on the 4H chart above, a confluence of three primary developments underscores the beginning of the new downtrend. First of all, the price action established a Double Top pattern, which is typically taken to signify likely bearish reversals.
Second of all, this pattern emerged just above the psychologically significant resistance level at 14000.00, which, as a major turning point, further alludes to the underlying reversal. Last but not least, the Right Top took the form of an ascending Wedge, which is also demonstrative of the significance of the breakdown that occurred there.
Following the breakdown below the 200-day MA (in purple), the price action is currently set to probe the next floating support - the 300-day MA (in orange). The latter signifies the upper boundary of an Accumulation range that could prompt the emergence of a minor bullish pullback.
In other words, bears should observe the behaviour of the price action between 12800.00 and 12896.00, as this range could incite the beginning of a bullish pullback that could extend to the Distribution range - spanning between 13433.00 and 13550.00 (underpinned by the 200-day MA and the 100-day MA).
Ultimately, the most significant target for the downtrend is encompassed by the 23.6 per cent Fibonacci retracement level at 12284.99.
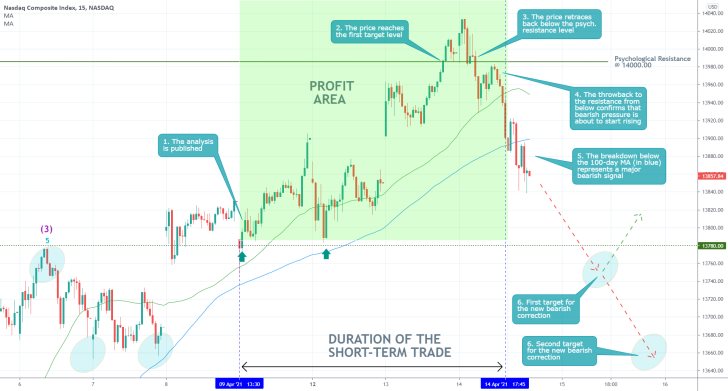
- The price of the Nasdaq behaved almost exactly as anticipated by our last analysis in that it tested the psychological resistance level before retracing back. The projected bearish correction may already have begun developing.
- Judging by the previous swing high and low, the price could dive to one of the two areas seen on the chart. Market bulls should wait for definite signs of the price finding support above the two blue spheres before they go long once again.
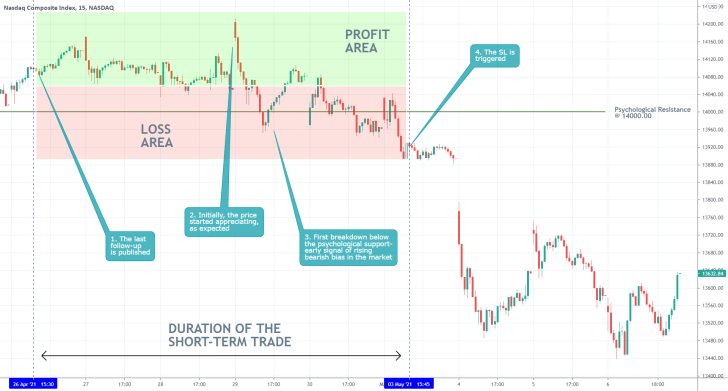
- Initially, the market started behaving as expected by the follow-up analysis. The price started appreciating but then an abrupt dropdown reached the SL area.
- The bearish reversal thus occurred sooner than expected. Nevertheless, it will be prudent to keep observing the future behaviour of the price action. It appears to be consolidating near the latest dip, which could allow bulls to go long at a discount.
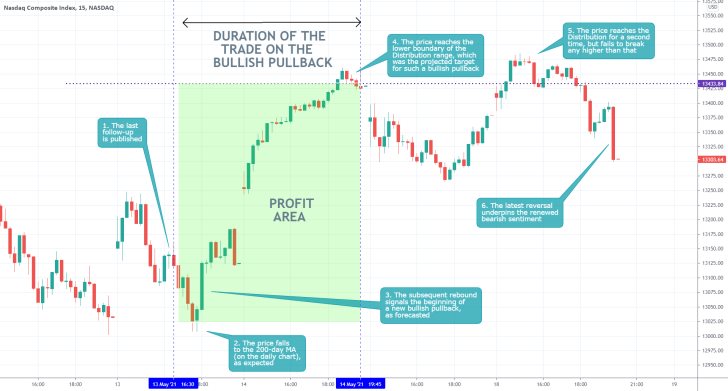
- The last follow-up successfully forecasted that after the price action reached the 200-day MA (as seen on the daily chart), the IXIC would likely establish a minor bullish pullback. It also quite accurately expected the pullback to reach the lower boundary of the Distribution range before the bullish bias starts to wane. An overall perfect execution.
- Even still, it should be emphasised that contrarian trading within an established trend entails a high degree of risk, even if the scope and direction of the correction are properly forecasted.
Disclaimer: Your capital is at risk! Trading and investing on the financial markets carries a significant risk of loss. Each material, shown on this website, is provided for educational purposes only. A perfect, 100% accurate method of analysis does not exist. If you make a decision to trade or invest, based on the information from this website, you will be doing it at your own risk. Under no circumstances is Trendsharks responsible for any capital losses or damages you might suffer, while using the company’s products and services. For more information read our Terms & Conditions and Risk Disclaimer.


